


EUR/USD Talking Points:
- EUR/USD remains in a very tight range as has been the case for much of the prior two months.
- As EUR/USD has ranged, a short-term ascending triangle has built.
- The analysis contained in article relies on price action and chart formations. To learn more about price action or chart patterns, check out our DailyFX Education section.

You’ll have to look very short-term to find any recent EUR/USD trends, because for t he past two months the largest and most pertinent pair in the FX market has built in a tighter and tighter range.
To be sure, there are significant levels at play. For support, prices are holding a zone from 1.1187-1.1212 that showed up ahead of the Thanksgiving holiday. Resistance isn’t as well defined but it’s been even more consistent, helping to hold the highs over multiple tests in the six weeks since support helped to cauterize the lows.
Inside of this very tight chop has been the recent development of a possibly-workable pattern, with a series of higher-lows meshing with that horizontal resistance, allowing for the build of an ascending triangle formation.
EUR/USD Daily Price Chart
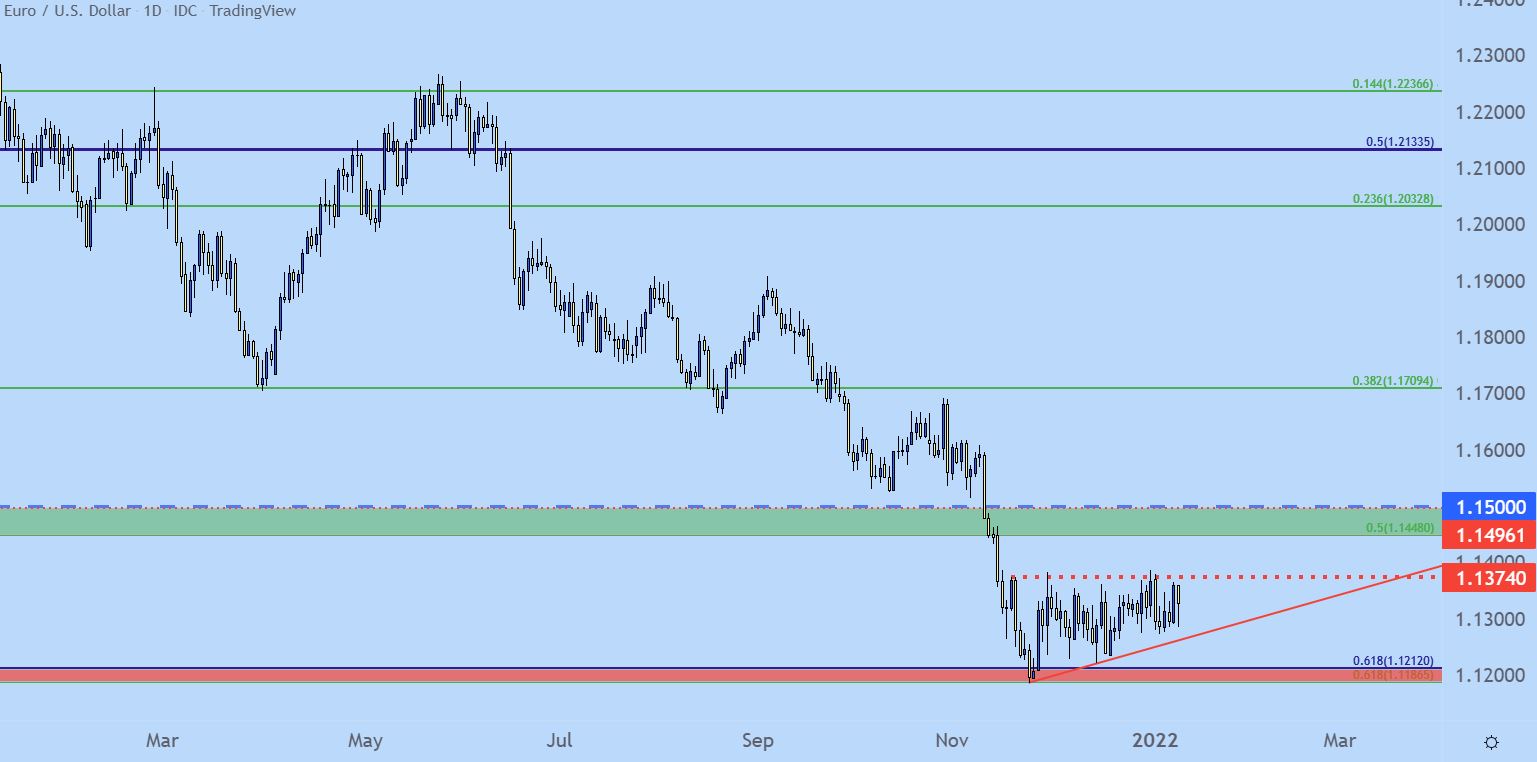
Chart prepared by James Stanley; EURUSD on Tradingview
EUR/USD Big Support
The zone that’s come into hold the lows is a big one. The price of 1.1187 is simply the 61.8% retracement of the 2017-2018 major move, but perhaps a more pertinent level lives just a little higher at 1.1212. That price is the 61.8% retracement of the ‘lifetime move’ in EUR/USD, taking the low from the year 1999 up to the 2008 high. And for the past seven years, this prices has had a recurring role in EUR/USD price action.
This level set the low in January of 2015, just before the pair went into a prolonged two-year-range. And during that range, this level helped to demarcate resistance. Prices launched higher in 2017 and remained above for much of the next year-and-a-half, eventually coming back into play in November of 2018.
EUR/USD Monthly Price Chart

Chart prepared by James Stanley; EURUSD on Tradingview
EUR/USD Range, US Dollar Range
Ever since this support zone came into play on EUR/USD the market has slowed to a snail’s pace for volatility, and in-turn, so has that of the US Dollar. Sellers have had ample opportunity to push EUR/USD lower, even amidst a seemingly supportive backdrop for USD longs, with the Fed growing more and more hawkish and rates markets quickly reflecting that dynamic.
On top of that, from a technical perspective, sellers have had ample opportunity to push the pair lower as this divergence between U.S. and European economies has only continued to grow. But, they haven’t yet, so there may be a reason and this is also something that can star to support a counter-trend thesis.
A short-term breakout above the 1.1375 resistance level then opens the door for a push up to another key zone running from 1.1448-1.1500. At that point, sellers have another chance and if resistance can show, bearish strategies may get attractive gain.
Alternatively and given this week’s CPI print set to be released on Wednesday, it’s worthy of mention, is breakdown potential should sellers finally test below the 1.1187 Fibonacci level.
EUR/USD Eight-Hour Price Chart
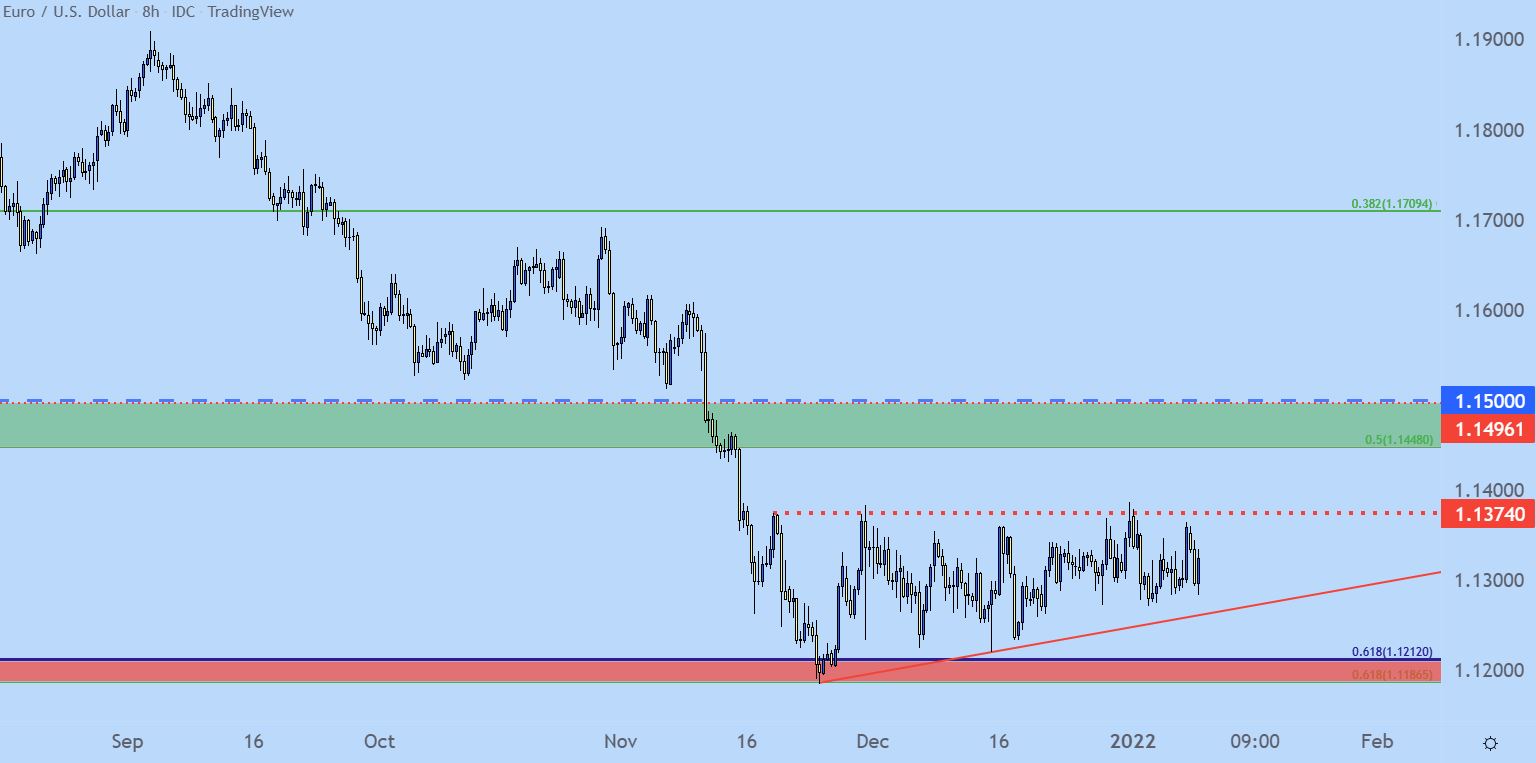
Chart prepared by James Stanley; EURUSD on Tradingview
--- Written by James Stanley, Senior Strategist for DailyFX.com
Contact and follow James on Twitter: @JStanleyFX


