


US Dollar Talking Points
- The US Dollar has traded up to another fresh four-month-high.
- This morning’s focus emanates from the release of January CPI, showing further inflationary gains.
- The US Dollar has moved into overbought territory on the Daily Chart via RSI; the first such occurrence since August of 2018.
US Dollar Strength Remains as Data Continues to Show Lacking Weakness to Support Rate Cuts
The US Dollar is back to being bid after a quick respite around the start of Humphrey Hawkins testimony on Tuesday of this week. Yet another strong US data point was released this morning with January CPI numbers.
Headline CPI continued to grow, printing at an annualized 2.5%, the highest level since October of 2018. This is also the fourth consecutive month of growth in that data point, and the third straight month of a print above the 2% marker. This also shows a brisk response in inflation to the Fed’s three rate cuts last year, taking place on August 1st, September 19th and October 31st. This extends a streak of positive US data, following last week’s Non-Farm Payrolls report and the previously-released Services and Manufacturing ISM reports.
US Headline CPI with Response to FOMC Rate Hikes (in Blue) and Cuts (in Red)
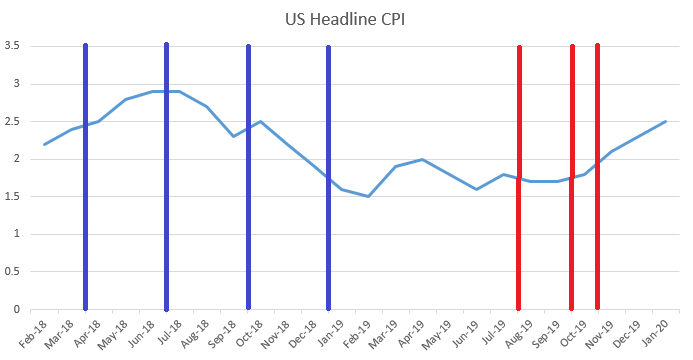
US Headline CPI Since February 2018, prepared by James Stanley
All-in-all, this has made for an aggressive ramp in the US Dollar so far through February trade.
US Dollar Daily Price Chart

From the above chart, the Relative Strength Indicator (RSI) has been added to show overbought/oversold conditions. Notice how the indicator has moved above 70 for the first time since August of 2018; and this follows two oversold signals from Q4 of last year, both of which came along with a bullish move in the USD.

At this point, the Greenback is battling through a level of resistance as taken from the 78.6% Fibonacci retracement of the Q4 sell-off. After holding bulls at bay around Day One of Powell’s testimony, buyers have pushed ahead with a bit of support showing around prior resistance.
US Dollar Hourly Price Chart

USD on Tradingview
--- Written by James Stanley, Strategist for DailyFX.com
Contact and follow James on Twitter: @JStanleyFX


