US ISM Manufacturing Talking Points:
- This morning brought the release of US ISM Manufacturing data, beating the expectation with a print at 50.9
- January ISM Manufacturing data follows a rough year of declines in the index
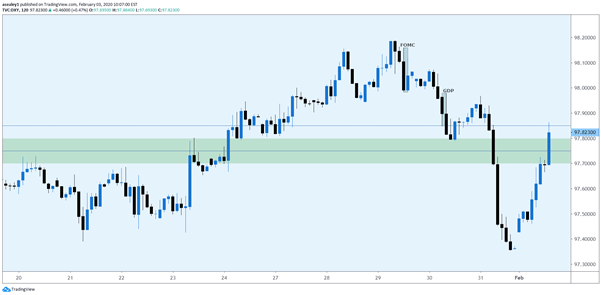
- The US Dollar is testing resistance after a late January bearish run
Manufacturing ISM Beats Expectations
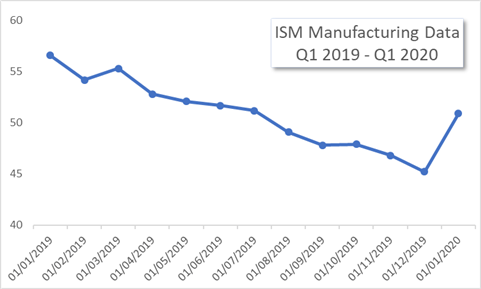
The Institute for Supply Management released their manufacturing sector report this morning for the month of January, beating the expectation of 48.5 with a print of 50.9.
This widely-watched indicator for us economic activity monitors changes in production levels from month to month. The index gives equal weight to new orders, production, employment, supplier deliveries, and inventories. As can be seen in the chart below, this print marks a turning point in US manufacturing activity with the first print above the 50.0 line in five months.

Since roughly the start of 2019, the ISM manufacturing index has fallen over 25.0%. While the index remained deep in expansion territory, or above 50.0, it crossed into contraction just before Q4 2019. Much of this movement can be explained by issues in trade policy and geopolitical issues, but further contraction may show signs of deeper problems.


US Dollar Two-Hour Price Chart

Chart Prepared by Austin Sealey; DXY on TradingView


