


British Pound Talking Points:
- The GBP pulled back to begin the year, fresh on the heels of a profusely strong bullish breakout in the month of December. With an exit date from the EU now set, will GBP bulls continue to reclaim lost ground?
- Those recovery moves have shown in a varied manner, running aggressively against the Yen and slightly less so against the US Dollar. EUR/GBP has been a bit quieter but, potential remains given the current technical backdrop.
GBP Claws Back Early-Year Losses
The New Year started off in a bearish manner for the British Pound, as GBP/USD fell from a perch above 1.3250 all the way down for a test below the 1.3000 psychological level. Support began to show in Cable on Monday, as taken from a bullish trendline projection connecting swing lows from November and December, and that support held through Tuesday trade until buyers were able to make a concerted push back above the big figure.
GBP/USD Daily – Threatening Topside Break of Bull Pennant

Chart prepared by James Stanley; GBPUSD on Tradingview
As looked at in the Tuesday webinar, at the time that support was setting-in there was a portion of unfilled gap remaining from this week’s open. That gap had projected around the 1.3050 level, and that gap has now been closed as buyers have continued to push as the week has progressed.
At this point, resistance potential shows around the resistance side of the recent wedge formation. Above that, a Fibonacci level at 1.3117 lurks overhead, and above that is another potential resistance level at 1.3187. On the support side of the matter, that same 1.3000-1.3013 remains of interest should this recent bullish advance falter.
| Change in | Longs | Shorts | OI |
| Daily | 3% | -7% | -3% |
| Weekly | 4% | -10% | -5% |
GBP/USD Two-Hour Price Chart
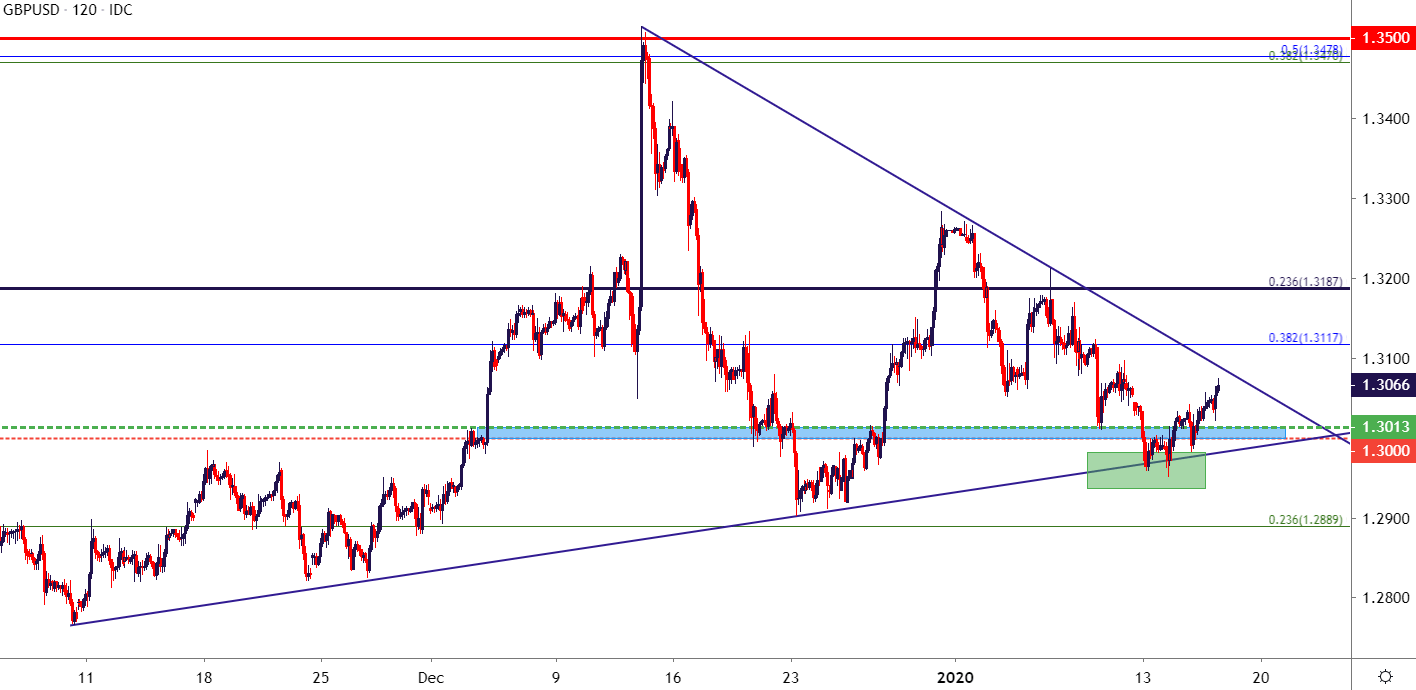
Chart prepared by James Stanley; GBPUSD on Tradingview
EUR/GBP Tests Near-Term Support After Resistance Hold
Another area of potential interest for Sterling bulls is against the Euro. EUR/GBP put in a stark 1,000+ pip run as Brexit optimism was getting priced back-in to the GBP from August-December of last year. The traditionally-rangy pair set a fresh three-year-low in December at .8276, finding a bit of pullback into year-end as shorts covered ahead of the New Year open. That recovery topped-out on December 23rd at .8592; and that level came back into play on Tuesday to help hold the highs; after which sellers started to re-enter the equation.
EUR/GBP Daily Price Chart

Chart prepared by James Stanley; EURGBP on Tradingview
At this point, sellers have pushed price action down to yesterday’s low for another inflection on near-term support; and below current price action remains a portion of unfilled gap from this week’s open, down to approximately .8515. Below the .8500 psychological level, support shows near the 2020 lows which have, similar to resistance, held two separate tests thus far in the New Year, around .8453.
| Change in | Longs | Shorts | OI |
| Daily | -4% | -2% | -4% |
| Weekly | -9% | 5% | -6% |
EUR/GBP Four-Hour Price Chart
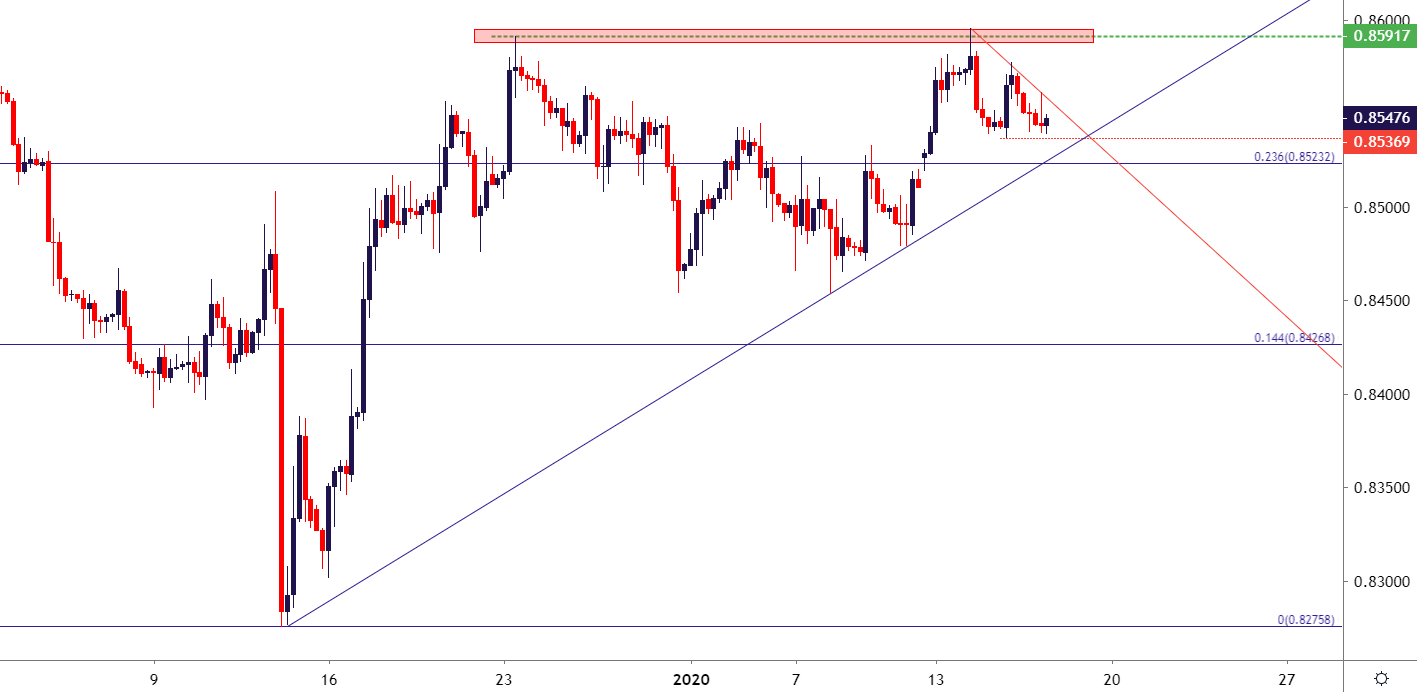
Chart prepared by James Stanley; EURGBP on Tradingview
GBP/JPY Tests Fibonacci Resistance at Weekly Highs
The British Pound continues to claw back early-year losses against the Japanese Yen. The quick spike of Yen-strength shortly after the 2020 open propelled price action all the way down below the 141.00 level, finding support at the same area that caught the early-December swing-lows. But as Sterling strength has continued to show, GBP/JPY has put in a topside move to find resistance at a key Fibonacci area on the chart, taken from the 38.2% retracement of the 2016-2018 major move on the chart. This was the same price that set support through March and April of last year, finally succumbing to selling pressure as Brexit-pessimism was getting priced-in last year.
GBP/JPY Daily Price Chart

Chart prepared by James Stanley; GBPJPY on Tradingview
On a shorter-term basis, a potential issue for bullish approaches is the rising wedge formation that’s built on the hourly chart. Such formations will often be approached with the aim of bearish reversals, and given the shorter-term nature of the formation, this wouldn’t necessarily obviate topside approaches as much as urge caution from chasing. This can place focus on support potential around levels such as 143.21, which was a prior point of resistance that came in to help set this morning’s swing-low. Below that, a zone of support potential exists from weekly low of 143.24 up to yesterday’s swing-low (and the start point of the formation) at 142.65. Should neither of those hold, the next spot below would be around the Fibonacci level at 141.50.
| Change in | Longs | Shorts | OI |
| Daily | 1% | -3% | -1% |
| Weekly | 13% | -31% | -17% |
GBP/JPY Hourly Price Chart
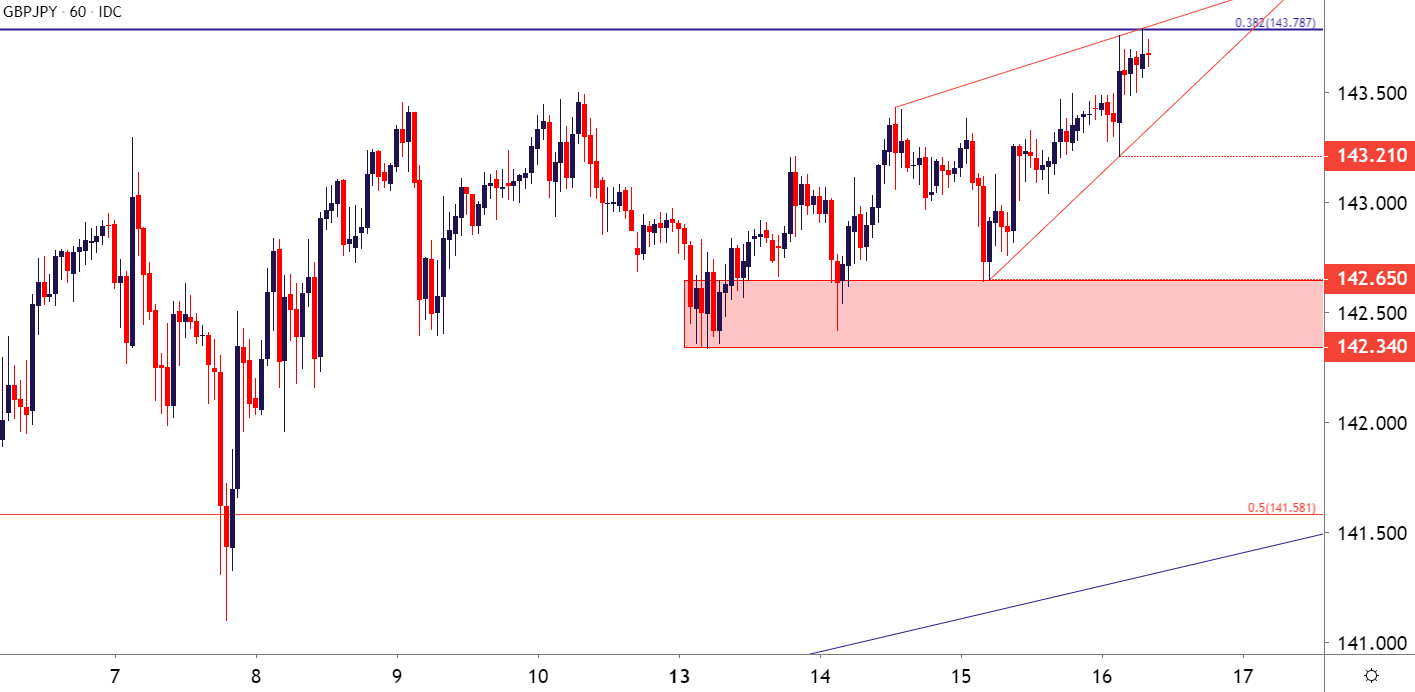
Chart prepared by James Stanley; GBPJPY on Tradingview
--- Written by James Stanley, Strategist for DailyFX.com
Contact and follow James on Twitter: @JStanleyFX


