


US Dollar, GBP/USD Talking Points:
- The US Dollar has continued to rally to fresh weekly highs, coming in stark contrast to the sell-off that dominated the currency into the 2019 close.
- GBP/USD is trading lower this morning following some dovish comments from BoE Governor, Mark Carney. GBP/USD remains in a longer-term bull pennant formation with shorter-term support via prior resistance coming in to help hold the lows.
US Dollar Continues Rally
The US Dollar has continued to rally over the past couple of days, extending a trend that runs in stark contrast to the way the currency closed 2019 trade. While the USD plunged to a fresh five-month-low on the final trading day of last year, an area of support came in to help hold the lows; and after a bit of gyration near that support, buyers have begun to claw back December losses in the currency.
I had looked into this one in Tuesday’s webinar, highlighting a short-term ascending triangle pattern. Such formations will often be approached with the aim of bullish breakouts, owed to the deductive nature of higher-low support coming in along with a horizontal level of resistance, indicating a waning impact from sellers at resistance as buyers get more and more anticipatory of bullish potential. That presented a situation in which long-term support was coupled with a short-term bullish pattern, which would still be considered counter-trend in nature given the veracity of the US Dollar’s Q4 sell-off.
US Dollar Four-Hour Price Chart

Chart prepared by James Stanley; US Dollar on Tradingview
The next operative question is generally, where to next? And sitting ahead on the chart is a very obvious zone of resistance that held the highs through multiple tests in December, and this comes in at a level with a bit of historical importance around 97.70. That price was resistance at the 2018 close and held inflections in November and December of that year. In 2019, this level held the highs through a third test in March and, later in the year, became an item of short-term support after the Greenback sell-off had started around the Q4 open.

US Dollar Daily Price Chart

Chart prepared by James Stanley; US Dollar on Tradingview
GBP/USD Folds to Support Following Carney Comments
Outgoing BoE Governor Mark Carney offered some comments to markets earlier this morning, with the net impact prodding BoE rate cut odds higher and the British Pound falling in response. This was discussed in detail by our own Justin McQueen in the article, GBP/USD Outlook Breaks Down on Dovish Carney, BoE Rate Cut Odds Jump.
This move-lower continues the short-term pattern of weakness that’s shown in the Pound following the aggressive bullish breakout of December. At this point, the daily chart shows a bull pennant formation, marked by a symmetrical wedge sitting atop that December breakout.
| Change in | Longs | Shorts | OI |
| Daily | 3% | -7% | -3% |
| Weekly | 4% | -10% | -5% |
GBP/USD Daily Price Chart
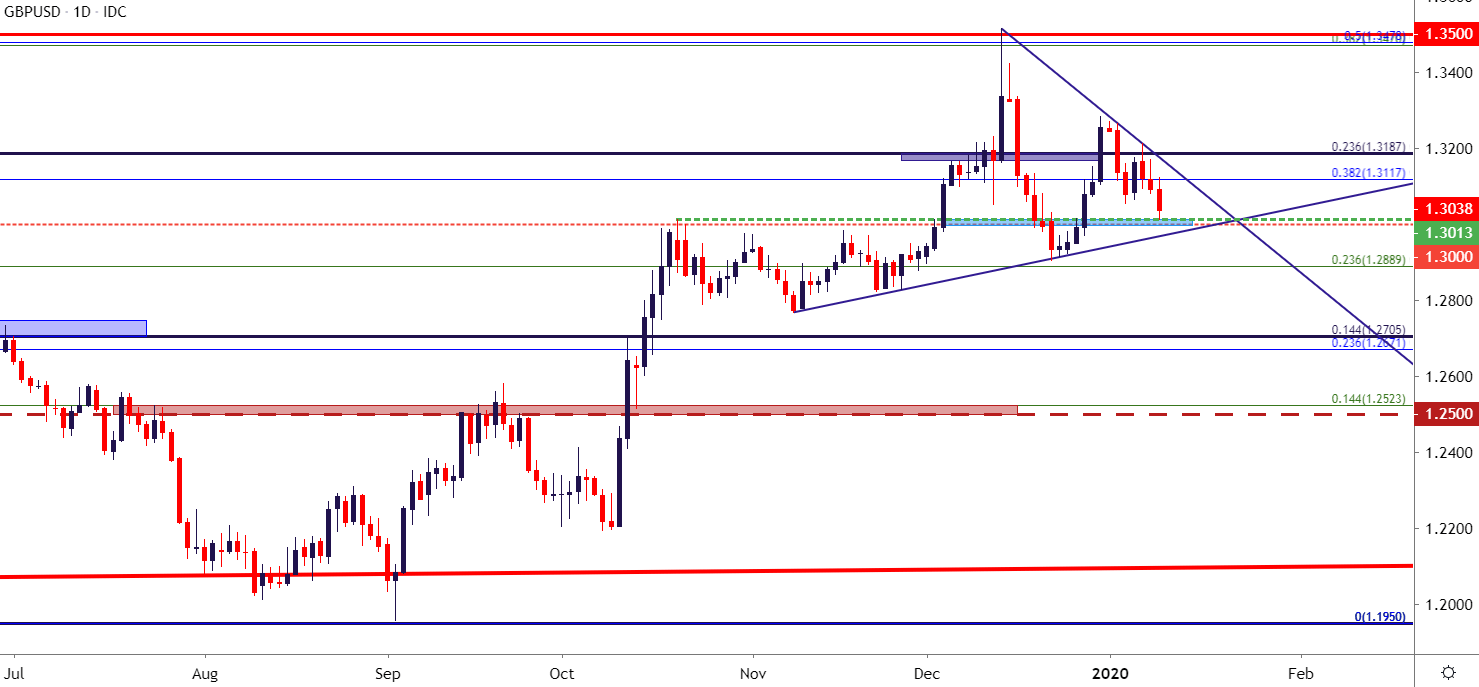
Chart prepared by James Stanley; GBPUSD on Tradingview
On a shorter-term basis, this morning’s BoE-fueled sell-off has pushed price action down to a key zone of support. The price of 1.3013, helping to set this morning’s low, was the previous swing high from the month of October; and it couples up with the 1.3000 psychological level to create a zone of interest that’s currently helping to hold support in the pair.
GBP/USD Four-Hour Price Chart

Chart prepared by James Stanley; GBPUSD on Tradingview
--- Written by James Stanley, Strategist for DailyFX.com
Contact and follow James on Twitter: @JStanleyFX


