


US Dollar Talking Points:
- The US Dollar sold off to fresh five-month-lows on the final trading day of last year; and has since built into a range with a bullish bias as taken from an upward sloping trendline.
- This carries correction potential which can be spanned across a number of major pairs; many of which were looked at in this archived webinar with a few highlights shared below.
It was a loud finish to 2019 for the US Dollar as the currency folded down to a fresh five-month-low on the final trading day of last year. Support showed up around a longer-term Fibonacci level at 96.47, similar to what had shown previously in December. This collection of underside wicks combined with the area at which they’re printing can make short-term bearish scenarios of challenge and may even keep the door open for near-term bullish scenarios.
US Dollar Weekly Price Chart
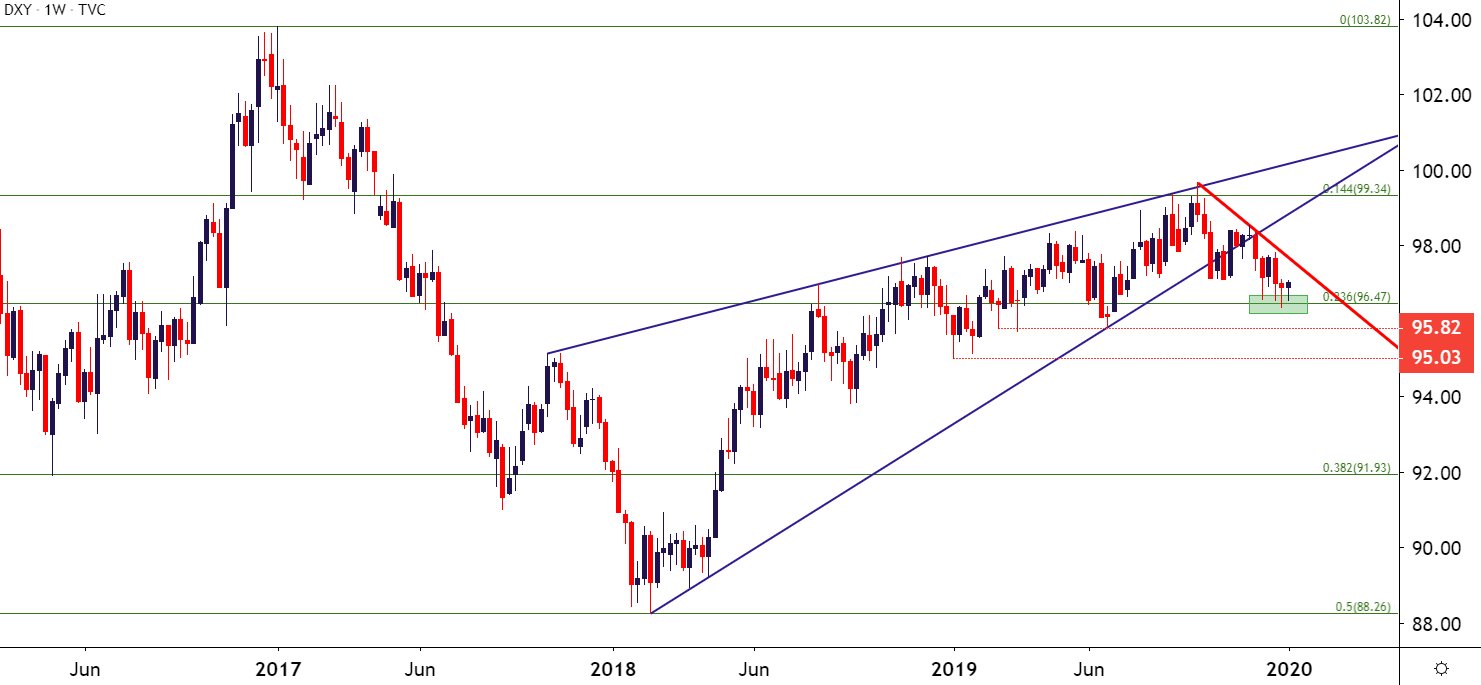
Chart prepared by James Stanley; US Dollar on Tradingview
On a shorter-term basis, the US Dollar has thus far spent 2020 trade within a range formation. Resistance has held from around a prior zone of support taken from 97.05-97.20; and support has shown at an upward-sloping trendline, leading to the build of an ascending wedge-like formation. This can also point to the potential for short-term strength, which would remain as a corrective move in the longer-term bearish scenario around the USD.
US Dollar Two-Hour Price Chart
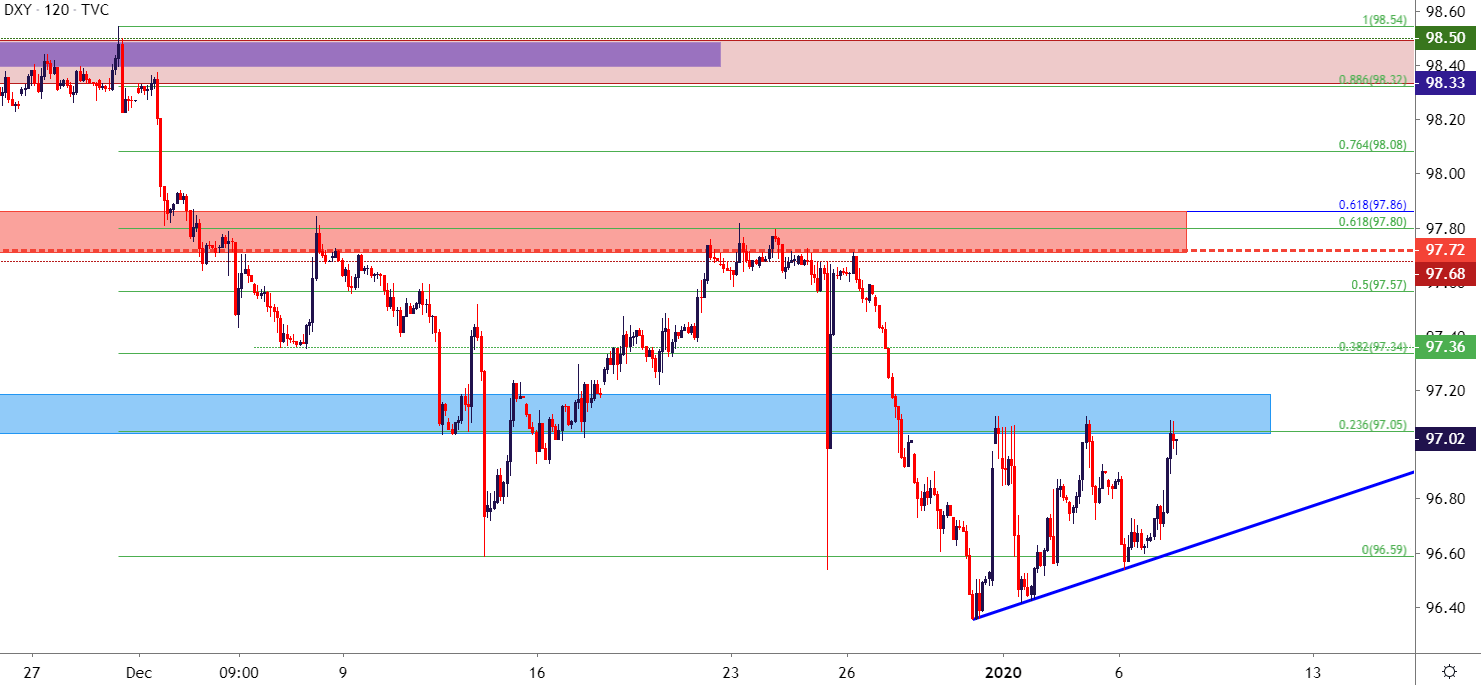
Chart prepared by James Stanley; US Dollar on Tradingview
EUR/USD Falls From Key Resistance
EUR/USD has had an interesting zone of resistance back in-play for over a year now, as the November 2018 swing-low was set just above the 1.1212 Fibonacci level. Last year saw a number of interesting items at this spot on the chart, including swing lows in March and April, resistance in May, support (again) in June and finally resistance in early-August, just before bears re-took control of the matter.
Yesterday saw this zone come back in as resistance, as discussed in the early-morning article on the US Dollar. That resistance held and sellers took another swing this morning; helping to keep the door open for short-term bearish strategies in the pair. This could remain one of the more interesting near-term candidates to work with USD-strength.
| Change in | Longs | Shorts | OI |
| Daily | -8% | -11% | -9% |
| Weekly | -15% | 25% | -4% |
EUR/USD Daily Price Chart

Chart prepared by James Stanley; EURUSD on Tradingview
USD/CAD Tests Below 1.3000 on the Final Trading Day of 2019
In a twist of irony, USD/CAD finally tested below the vaulted 1.3000 level on the final trading day of last year. Two separate incidents earlier in 2019 looked promising to bring in a sub 1.3000 print, with each failing as price action was mere pips away. This took place in July and then again in November. This can keep the door open for bearish scenarios in the pair, with the primary challenge at this point being to catch lower-high resistance. Such potential exists around 1.3042, 1.3065, 1.3102 and 1.3132. After that, the question must be asked as to whether something in the backdrop has shifted.
| Change in | Longs | Shorts | OI |
| Daily | -12% | -7% | -9% |
| Weekly | 27% | -12% | -2% |
USD/CAD Daily Price Chart

Chart prepared by James Stanley; USDCAD on Tradingview
AUD/USD: Bulls Fold on Prospect of RBA Softening
I had also looked into this pair yesterday, somewhat surprised at the late-year strength that drove AUD/USD back-above the .7000 handle. This runs in stark contrast to the bearish backdrop that had become so commonplace since January of 2018. But – that theme of strength has quickly unraveled over the past 24 hours as the RBA has hinted towards future softening. At this stage, bearish strategies may soon come back into order on the pair. A zone of lower-high resistance potential exists around .6930.
| Change in | Longs | Shorts | OI |
| Daily | -4% | -10% | -6% |
| Weekly | -1% | 25% | 3% |
AUD/USD Four-Hour Price Chart
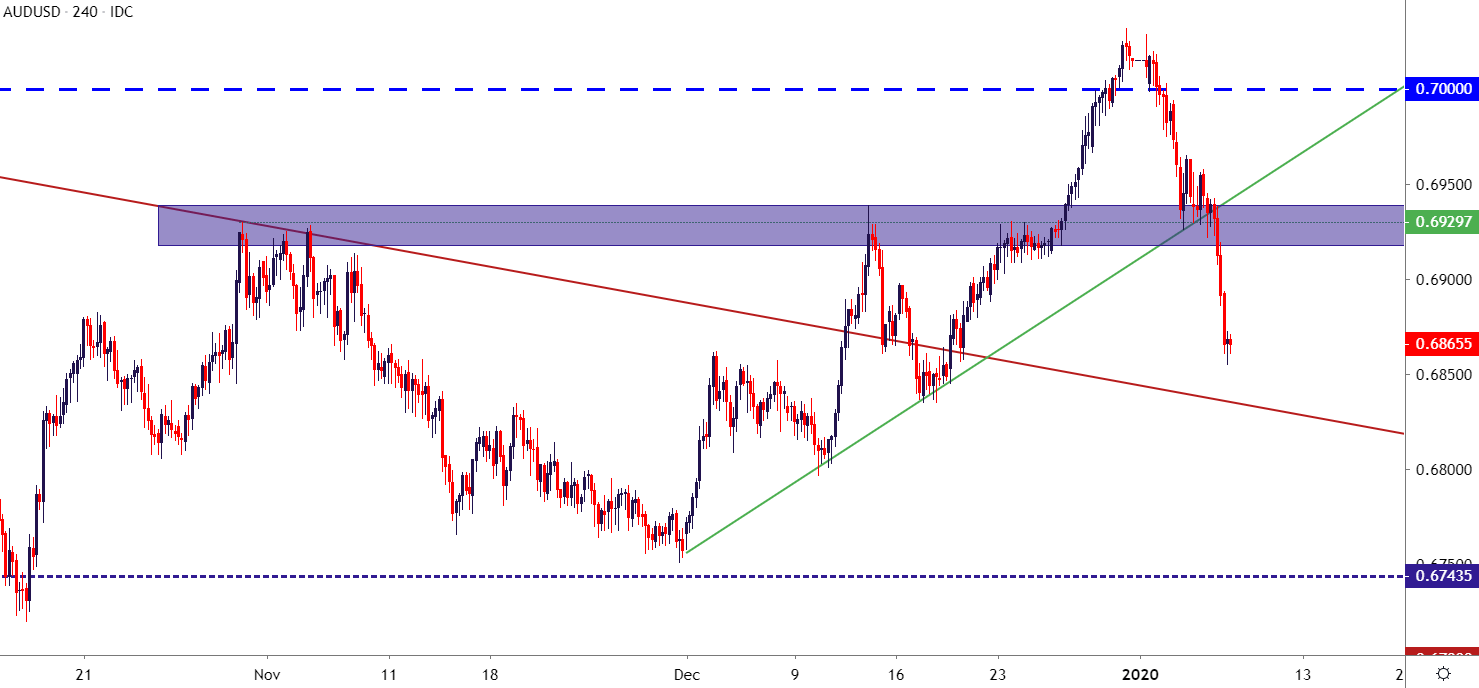
Chart prepared by James Stanley; AUDUSD on Tradingview
--- Written by James Stanley, Strategist for DailyFX.com
Contact and follow James on Twitter: @JStanleyFX


