EUR/USD, Euro Talking Points:
- EUR/USD has seen a return to support following a strong month of June, showing a far different tonality so far in July/Q3 than what was present last month.
- At the source of that move, US Dollar has come back and the FOMC remains in the spotlight this week with a number of Fed speeches populate the economic calendar along with the Wednesday-Thursday testimony from FOMC Chair, Jerome Powell.
- DailyFX Forecasts are published on a variety of markets such as Gold, the US Dollar or the Euro and are available from the DailyFX Trading Guides page. If you’re looking to improve your trading approach, check out Traits of Successful Traders. And if you’re looking for an introductory primer to the Forex market, check out our New to FX Guide.
EUR/USD Returns to Key Support
The Q3 open has so far seen a return of sellers in EUR/USD, following a month of June that saw bears get squeezed as US Dollar weakness had showed up. Behind that USD weakness was a seemingly dovish outlay at the Federal Reserve in which the bank highlighted the prospect of a rate cut in the second-half of this year. But, as that dovish scenario was getting priced-in to markets through the both bonds and the US Dollar, stocks continued to rally, eventually pushing up to fresh all-time-highs. And then all-of-the-sudden, that dovish backdrop around the Fed didn’t look as probable as it did around the June open.
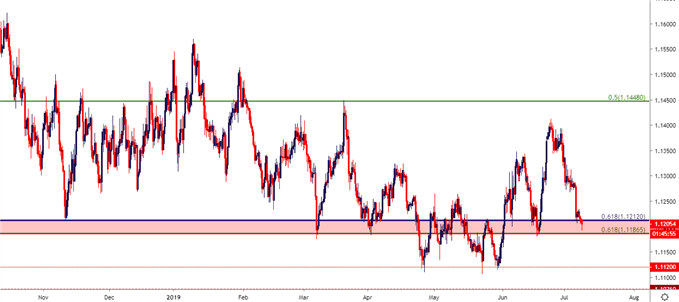
At this point, USD strength has been consistently showing since the July open, and this week will see the currency stay on center-stage as a series of Fed speeches populate the calendar, highlighted by the two-day testimony from FOMC Chair Jerome Powell on Capitol Hill. That takes place on Wednesday and Thursday and leading into that event, EUR/USD is sitting at an area of support that’s been in-play in various fashions since last November. This zone runs from the 1.1187 Fibonacci level up to the 1.1212 level, the latter of which is the 61.8% retracement of the ‘lifetime move’ in EUR/USD.
This zone was last in-play on the pair around the June FOMC rate decision, helping to set the mid-month swing low ahead of EUR/USD pushing up to fresh two-month-highs.
EUR/USD Eight-Hour Price Chart

Chart prepared by James Stanley
Have Euro Shorts Been Squeezed Enough?
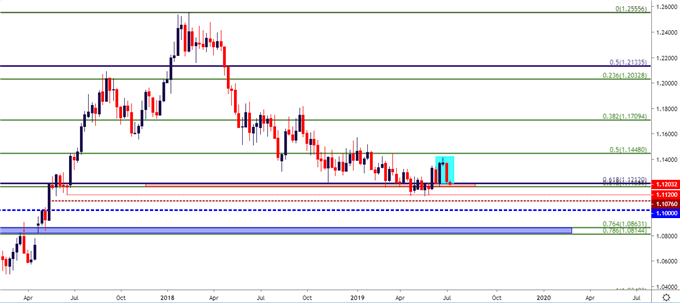
Last month’s bout of strength in EUR/USD can be at least partially assigned to a short-squeeze scenario. After a down-trend that lasted well over a year, sellers seemed to dry up in the month of May, posing a series of bear trap scenarios as price action held above the 1.1100 handle. This helped the pair to build into a falling wedge formation, which will often be approached for bullish reversals. And that theme began to price-in during the month of June, assisted by the bout of USD-weakness brought upon by that dovish backdrop around the Fed.
But, another formation has now popped-up on the weekly chart, and that’s an evening star formation that will often be used to mark bearish reversal potential. As the strength from three weeks ago ran into indecision in the week after, last week saw sellers return, and this may soon open the door to the prospect of lower-lows in the pair.
This begs the question: Is the short-squeeze over, and are Euro sellers ready for that trip back down to the 1.1000 handle that hasn’t been tested in more than two years?
EUR/USD Weekly Price Chart

Chart prepared by James Stanley
US Dollar Strength Comes Rushing Back
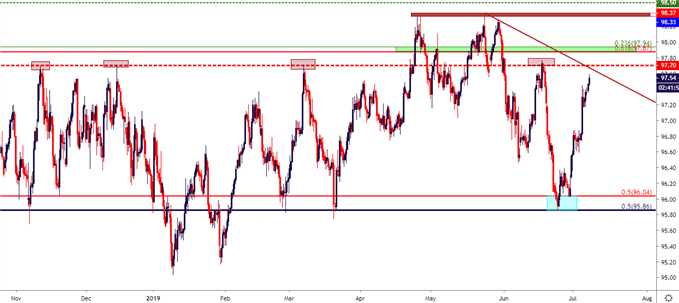
Going along with that move of weakness in EUR/USD has been a return of strength in the US Dollar after a month-long hiatus. The Dollar pushed down to a fresh three-month-low just two weeks ago, eventually finding support around the 96.03 Fibonacci level, which is the 50% marker of the 2017-2018 major move. And since the July/Q3 open, bulls have very much been in-charge, posing a push back towards the 97.70 level of resistance that had previously functioned as the yearly-high in the pair.
The short-term move appears quite stretched in USD, but with so many drivers sitting on the economic calendar for the remainder of this week, the potential for more certainly remains. The next item of resistance potential sits just ahead, taken from a bearish trend-line connecting the late-May swing highs, which is near confluent with that 97.70 price. Above that, potential resistance exists in a zone created by Fibonacci levels at 97.86-97.94, after which the 98.32-98.34 area lurks as a prior double-top formation at the current yearly high.
US Dollar Eight-Hour Price Chart

Chart prepared by James Stanley
To read more:
Are you looking for longer-term analysis on the U.S. Dollar? Our DailyFX Forecasts have a section for each major currency, and we also offer a plethora of resources on Gold or USD-pairs such as EUR/USD, GBP/USD, USD/JPY, AUD/USD. Traders can also stay up with near-term positioning via our IG Client Sentiment Indicator.
Forex Trading Resources
DailyFX offers an abundance of tools, indicators and resources to help traders. For those looking for trading ideas, our IG Client Sentiment shows the positioning of retail traders with actual live trades and positions. Our trading guides bring our DailyFX Quarterly Forecasts and our Top Trading Opportunities; and our real-time news feed has intra-day interactions from the DailyFX team. And if you’re looking for real-time analysis, our DailyFX Webinars offer numerous sessions each week in which you can see how and why we’re looking at what we’re looking at.
If you’re looking for educational information, our New to FX guide is there to help new(er) traders while our Traits of Successful Traders research is built to help sharpen the skill set by focusing on risk and trade management.
--- Written by James Stanley, Strategist for DailyFX.com
Contact and follow James on Twitter: @JStanleyFX


