


Talking Points:
- The past 24 hours have brought a series of interesting drivers into FX markets, with last night’s RBNZ rate decision leading into this morning’s ‘Super Thursday’ at the Bank of England. Shortly after that rate decision concluded at the BoE, we received April inflation numbers out of the United States.
- While US inflation remains strong, with headline printing at one-year highs while Core inflation remained above 2%, the US Dollar is pulling back after what’s been an aggressively-strong three-week run. The big question at this point is whether we see re-ignition of the longer-term bearish drive, or whether this morning’s sell-off is a pullback in a move of bullish continuation in USD. We look at pairs for either scenario below, looking to GBP/USD for a deeper reversal of USD-strength and the short-side of NZD/USD for a continuation of this recent theme.
- DailyFX Forecasts have been updated for Q2, and are available from the DailyFX Trading Guides page. If you’re looking to improve your trading approach, check out Traits of Successful Traders. And if you’re looking for an introductory primer to the Forex market, check out our New to FX Guide.
Do you want to see how retail traders are currently trading the US Dollar? Check out our IG Client Sentiment Indicator.
US Inflation Numbers (CPI), Bank of England ‘Super Thursday, RBNZ Rate Decision
It’s already been a busy morning across global markets as we near the US equity open. The Bank of England hosted their second ‘Super Thursday’ rate decision of the year, and this one had a far different tonality than the prior event in February. And just a little after that rate decision, we got US inflation numbers for the month of April. Also of interest on the macro-economic front was a rate decision out of the Reserve Bank of New Zealand last night, and below, we’ll look at these events in reverse chronological order.
US Dollar Drops on Mixed Bag of Inflation Results
Last month’s inflation print out of the US surprised to the upside, and about a week after that data was released, the US Dollar set support and began to trend-higher in a move that’s lasted all the way into this week. The Dollar has gained by almost 5% in just over a few weeks, and given the timing of the move, it would appear that related-events in the UK and Europe may have been a primary culprit behind the move.
April inflation numbers remained strong in the US, with headline inflation meeting the expectation of 2.5% to produce another fresh one-year high, while Core inflation disappointed, coming in at 2.1% versus the expectation of 2.2%. This would still match last month’s print, which was a one-year high in-and-of-itself, and this keeps inflation above the Fed’s target, laying the groundwork for a hike at the bank’s June meeting in just a little over a month.
US Headline CPI at Annualized 2.5% in April
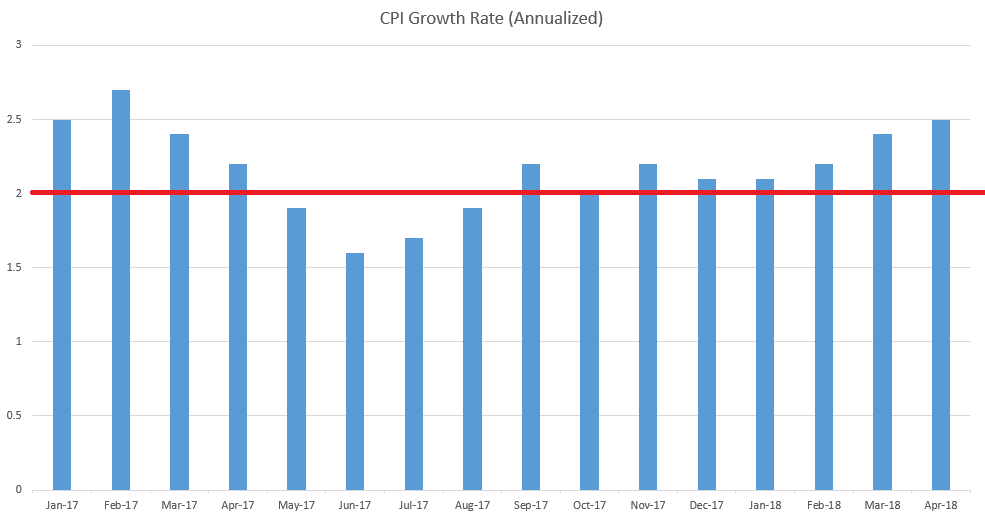
Chart prepared by James Stanley
The net response to this continued gain in inflation has thus far been a move of USD-weakness. However, considering the backdrop, this can make sense. The Dollar has been surging over the past few weeks as rate hike bets have been getting kicked further-out into the future out of both the UK and Europe. The fact that core inflation printed in-line with last month and below the expectation of 2.2% might have provided enough motivation for Dollar bulls to square up positions after the recent rally; allaying fears of ‘runaway inflation’ after the upside surprise from last month.
US Core CPI, Annualized

Chart prepared by James Stanley
US Dollar Pulls Back to Support After Inflation Data
We’ve been following an area of resistance in the US Dollar around the 93.35 level in ‘DXY’. This level helped to show some resistance on Tuesday, along with a doji around yesterday’s price action. So far today, we’re getting a visible reversal that’s showing a non-completed Evening Star formation. These formations can be attractive for playing bearish reversals, and if we do see prices close on the Daily with this formation intact, the door for a return of bearish price action re-opens.
US Dollar Daily Chart: Reversal Formation (Not Yet Completed) Near Resistance

Chart prepared by James Stanley
On a shorter-term basis, that prospect of a bearish move has been growing more attractive. We looked into the setup yesterday, investigating a series of support levels after the recent topside run. Prices are now scaling-back, catching some support at the ‘s1’ level we looked at yesterday around 92.66, and just below current prices we have a few more levels of interest at 92.50, 92.22 and again at 91.92.
DXY Two-Hour Chart: Pullback to Support After Release of April Inflation Numbers
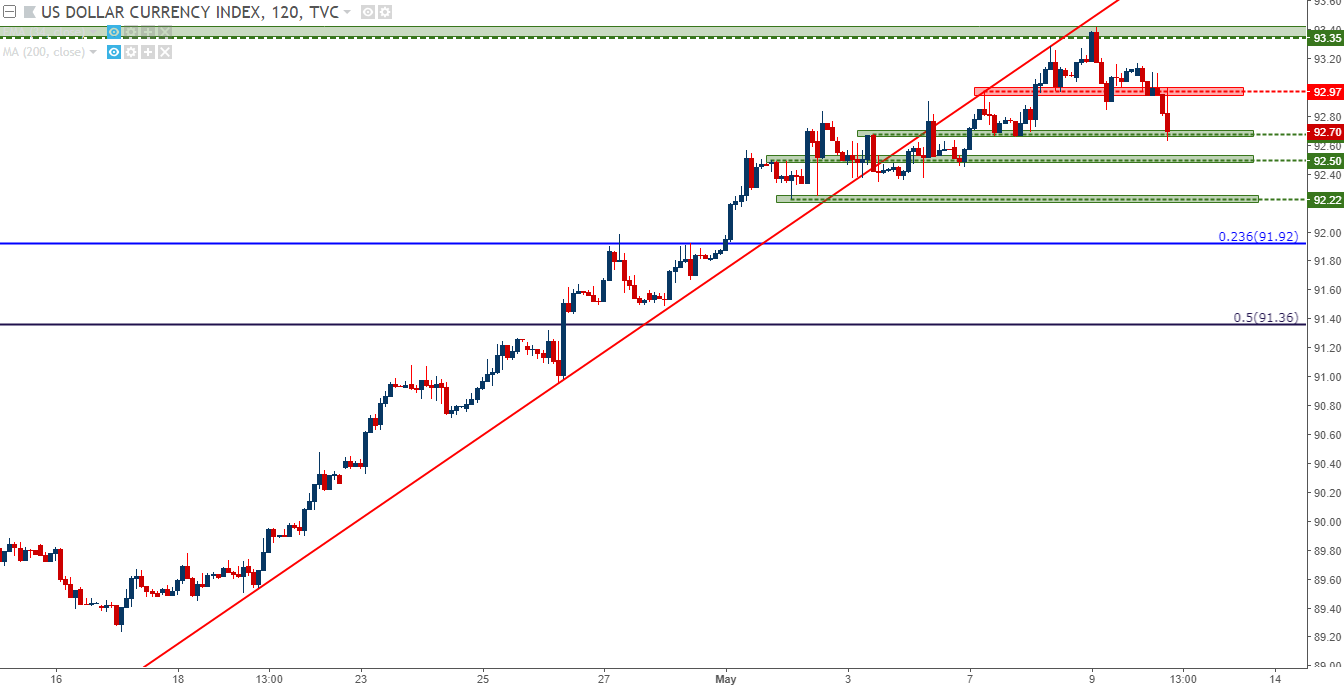
Chart prepared by James Stanley
BoE: Back to ‘Limited and Gradual’ After February’s ‘Faster and Somewhat Greater’
At this morning’s ‘Super Thursday’ rate decision from the Bank of England, the Monetary Policy Committee voted 7-2 to keep rates at current levels. The bank did take an upbeat outlook towards future economic conditions, and this helped to moderate the reaction in the British Pound, at least for now. The BoE said that they expect growth to bounce back after the Q1 slumber, while also expecting inflation to continue to soften to the point where they may not need a rate hike in 2018. The BoE did, however, forecast three hikes over the next three years, and this is largely based on the expectation for the strength in the British economy from last year to come back, and if this happens soon enough, there may be potential for a hike at the next Super Thursday meeting in August.
Nonetheless, this amounted to a large reversal of the bank’s stance in February when they warned that rate hikes would be likely coming in faster and to a somewhat greater extent than previously forecast. At this morning’s press conference, Mr. Carney used a familiar phrase numerous times to really hammer the point home, saying that rate hikes would be ‘limited and gradual.’ This is speech we’ve heard numerous times over the past year as inflation surged above 3% in the UK; only being abandoned in February as the bank primed the market for more rate hikes.
Cable Back to Support
In response to this morning’s rate decision, GBP/USD moved back down to the support zone that’s been holding the lows in the pair over the past week. This area comes in at key zone around 1.3500, which was near the low in GBP/USD from the Financial Collapse that held all the way into Brexit. This is also very near the 50% retracement of the ‘Brexit move’ in the pair, and since that aggressive down-trend ran into this level last week, prices haven’t yet broken-below.
GBP/USD Daily Chart: Oversold and A Week of Grind at Key Support, Through BoE
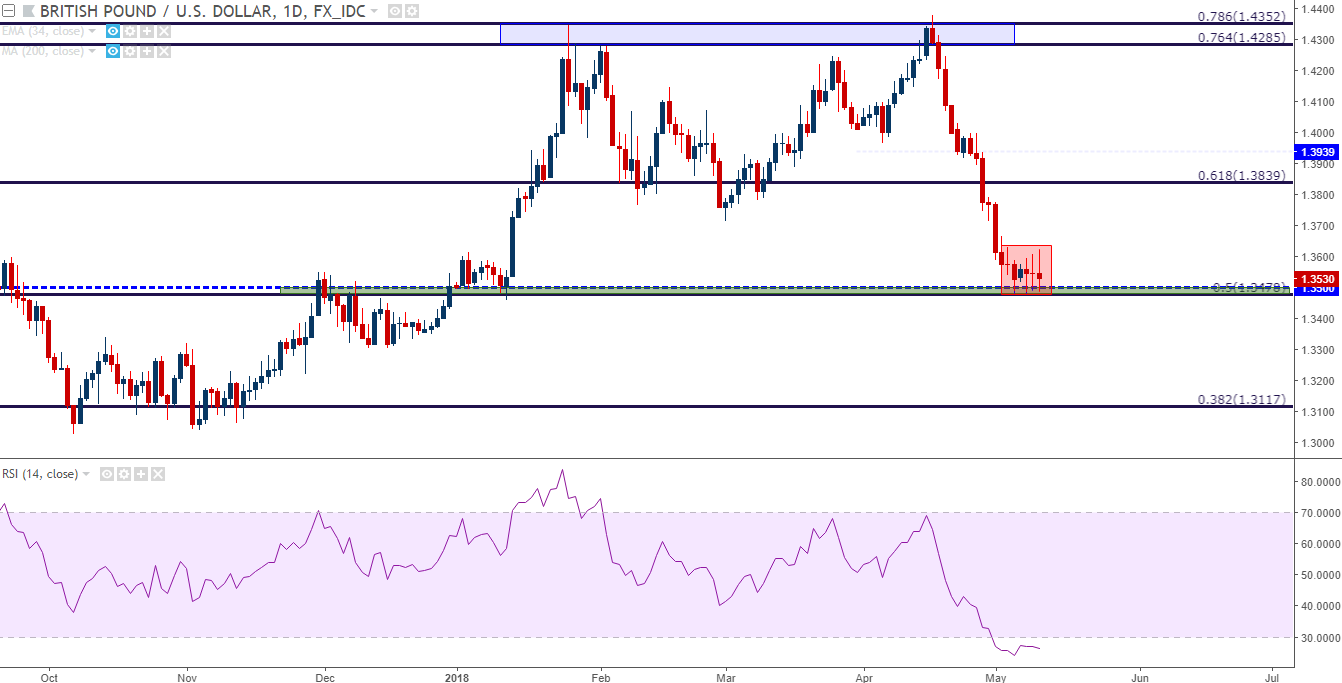
Chart prepared by James Stanley
While support holding is far from a certainty, it does open the door to a rather interesting reversal setup in the pair, particularly if given a backdrop of a weakening US Dollar. The support zone from 1.3478-1.3500 has held up multiple down-side tests this week, and as we approach the next iteration of UK inflation data, the pair continues to hold potential.
GBP/USD Hourly Chart: Carney Brings Support Test to Cable

Chart prepared by James Stanley
GBP/JPY with Bearish Potential
For those that are looking at bearish continuation in the British Pound, GBP/JPY may be a bit more attractive. We looked into the setup yesterday while showing setups on both sides of the pair. After another visit to resistance, prices have moved lower, opening the door for a re-test of 147.71 followed by a potential move down to 147.03.
GBP/JPY Hourly Chart: Resistance Check, Bearish Continuation Potential

Chart prepared by James Stanley
Kiwi Touches First Target After RBNZ
Last night brought a rate decision out of New Zealand to markets, and of recent, NZD/USD has been one of our favored pairs for playing USD-strength. This was the topside USD-setup in this week’s FX setups, and after a bearish breakout was triggered earlier in the week, the first target at .6900 came into play shortly after the rate decision.
The RBNZ remained loose and passive with no near-term signals of rate hikes on the horizon. After this morning’s USD pullback, NZD/USD is rallying off of a recent lower-low, and this can open the door for those looking to buy the US Dollar after this morning’s move; largely driven by the expectation for the strength of the past few weeks to continue to drive the currency higher.
The psychological level of .7000 is now confluent with a bearish trend-line that’s held the highs in the pair for the past few weeks, and if we do see a re-test here, the door re-opens for short-side setups, targeting a move back towards longer-term range support of .6820-.6870.
NZD/USD Two-Hour Chart: Confluent Resistance Potential Around .7000 Big Figure

Chart prepared by James Stanley
To read more:
Are you looking for longer-term analysis on the U.S. Dollar? Our DailyFX Forecasts for Q1 have a section for each major currency, and we also offer a plethora of resources on USD-pairs such as EUR/USD, GBP/USD, USD/JPY, AUD/USD. Traders can also stay up with near-term positioning via our IG Client Sentiment Indicator.
Forex Trading Resources
DailyFX offers a plethora of tools, indicators and resources to help traders. For those looking for trading ideas, our IG Client Sentiment shows the positioning of retail traders with actual live trades and positions. Our trading guides bring our DailyFX Quarterly Forecasts and our Top Trading Opportunities; and our real-time news feed has intra-day interactions from the DailyFX team. And if you’re looking for real-time analysis, our DailyFX Webinars offer numerous sessions each week in which you can see how and why we’re looking at what we’re looking at.
If you’re looking for educational information, our New to FX guide is there to help new(er) traders while our Traits of Successful Traders research is built to help sharpen the skill set by focusing on risk and trade management.
--- Written by James Stanley, Strategist for DailyFX.com
To receive James Stanley’s analysis directly via email, please SIGN UP HERE
Contact and follow James on Twitter: @JStanleyFX


