


Talking Points:
- The bullish surge in the US Dollar has finally found some element of resistance around the 93.35 level. Tomorrow brings US CPI for the month of April, and this comes on the heels of what was a really strong inflation report from the month of March. While many are attributing the recent bullish move in USD to that inflation report, the timing doesn’t exactly fit, as the US Dollar moved down to a fresh near-term low in the week after that report was released. US Dollar strength became a key theme after last month’s UK inflation and then the ECB meeting later in the month.
- The US Dollar is pulling back as we approach tomorrow’s release, and this opens up a series of setups on both sides of the Greenback. We looked into this in our webinar yesterday, and many of those themes still apply. This is available from the article entitled, US Dollar Pulls Back from 2018 Highs: Price Action Strategy.
- DailyFX Forecasts have been updated for Q2, and are available from the DailyFX Trading Guides page. If you’re looking to improve your trading approach, check out Traits of Successful Traders. And if you’re looking for an introductory primer to the Forex market, check out our New to FX Guide.
Do you want to see how retail traders are currently trading the US Dollar? Check out our IG Client Sentiment Indicator.
US Dollar Finds Resistance Ahead of Tomorrow’s CPI Release
The surging trend in the US Dollar has started to show some element of resistance after what’s become an aggressively bullish past three weeks. As we traded into mid-April, the US Dollar held a range near long-term support, and that theme lasted even through last month’s US CPI data. This is when inflation printed at one-year highs, evoking a higher degree of probability for that fourth rate hike from the Fed this year. But, no more than a week after that print we got UK inflation numbers for the month of March, and when these printed in a disappointing fashion, rate hike bets around the BoE started to get kicked further-out into the future. This helped to bring a concerted drop to GBP/USD, and that move has lasted all the way into May. A week later, a dovish ECB meeting helped to produce a similar result in the Euro, with the net takeaway being a really strong US Dollar as rate hike or stimulus-exit bets around the ECB were getting priced-out further.
This amounted to as much as a 4.7% gain in the Greenback from the April 18th lows, which tallies a 5.8% move from the February lows. Considering the fact that this is a non-levered currency that we’re looking at, and that’s a very respectable move in a very short period of time. Naturally, the question draws towards continuation potential and whether or not there’s any more juice in this bullish squeeze; or whether a pullback is in order as the currency has quickly become overbought.
US Dollar Weekly Chart
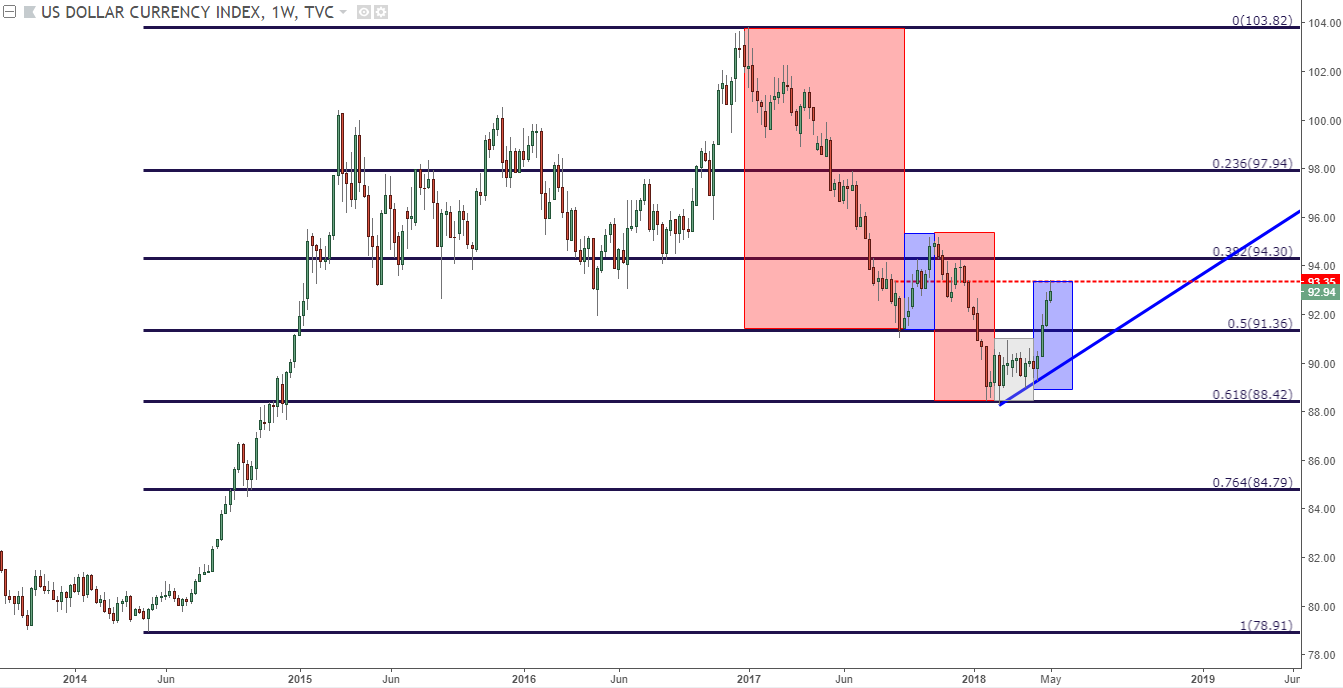
prepared by James Stanley
April Inflation Numbers are On Deck
Tomorrow brings US inflation numbers for the month of April, and this theme of Dollar-strength will be on full view as market participants attempt to gauge just how hawkish the Fed might be later in the year; and whether or not we’re looking at a total of three or four rate hikes for 2018. Last month’s inflation, while not showing a direct drive of US Dollar strength, was rather strong. Headline CPI came-in at one-year highs of 2.4%, marking the seventh consecutive month of inflation printing at-or-above the Fed’s 2% target.
US CPI at One-Year Highs in March, Seven Consecutive Months at 2% or Higher
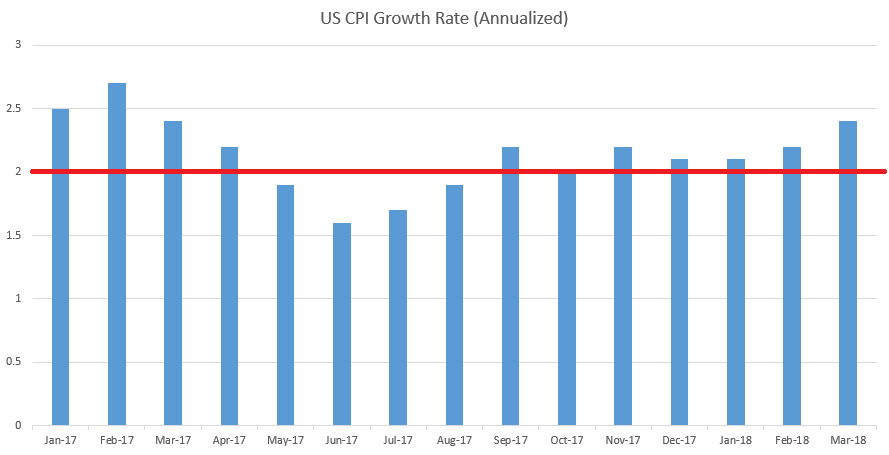
prepared by James Stanley
Perhaps even more compelling from last month’s inflation print was Core CPI, which printed above 2% for the first time in over a year, also coming in at fresh one-year highs. This will likely be a key driver in tomorrow’s report, as continued strength in core inflation will likely be a bit more pertinent to the Fed outside of any aggressive surprises in the headline print.
April Core CPI Prints Above 2% For First Time in a Year
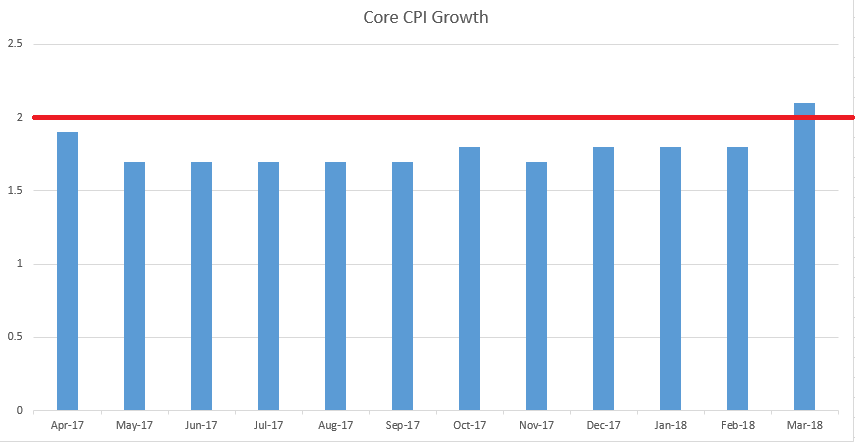
prepared by James Stanley
US Dollar Runs into Resistance Ahead of Inflation
That topside run in the US Dollar has finally run into some element of resistance over the past day, and this comes in around a level that we looked at last week around 93.35, just after the US Dollar set a fresh 2018 high.
US Dollar via ‘DXY’ Daily Chart: Topside Run Finds Resistance Around 93.35 Area
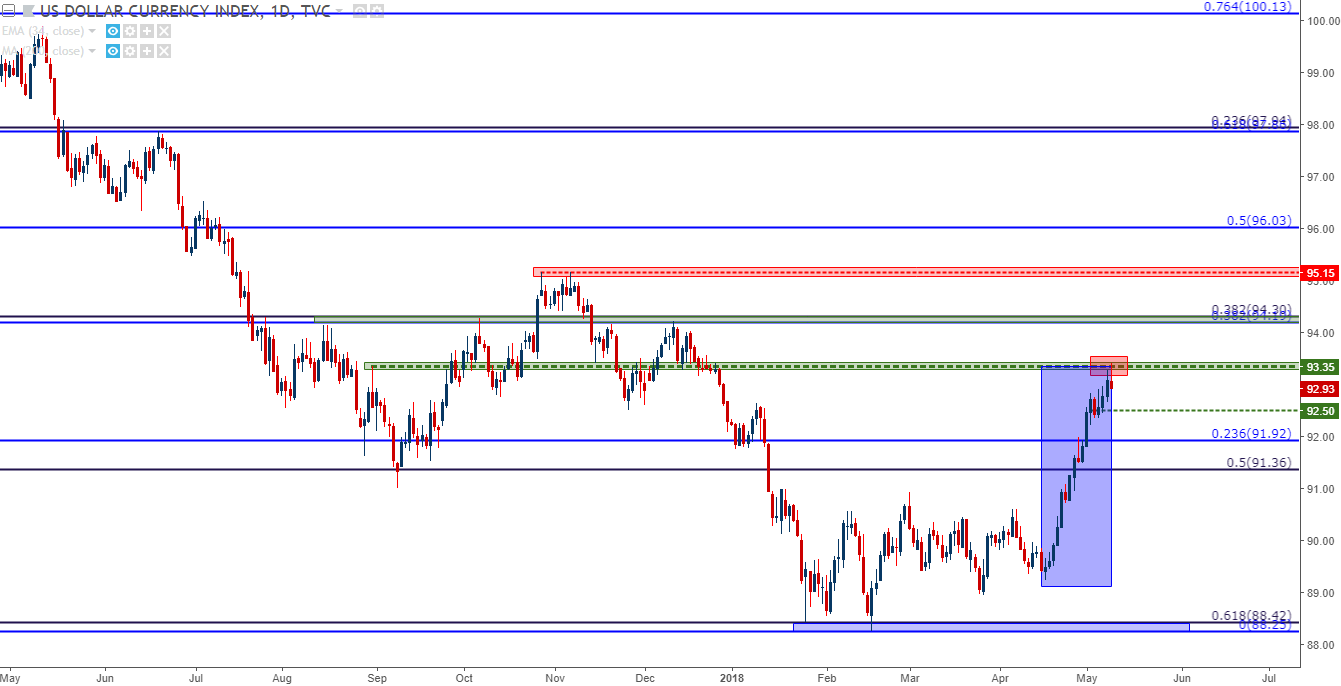
Chart prepared by James Stanley
Since prices began pulling back, bulls have started to get a bit more shy around prior areas of higher-low support. We had looked at the 92.97 level in yesterday’s webinar, and that price is being tested around the US open: The lack of response thus far indicates that we may be seeing a continued retracement towards a deeper point of support, such as 92.66, 92.50 or perhaps even 92.20.
US Dollar via ‘DXY’ Hourly Chart: Pullback from Resistance Exposes Potential Supports
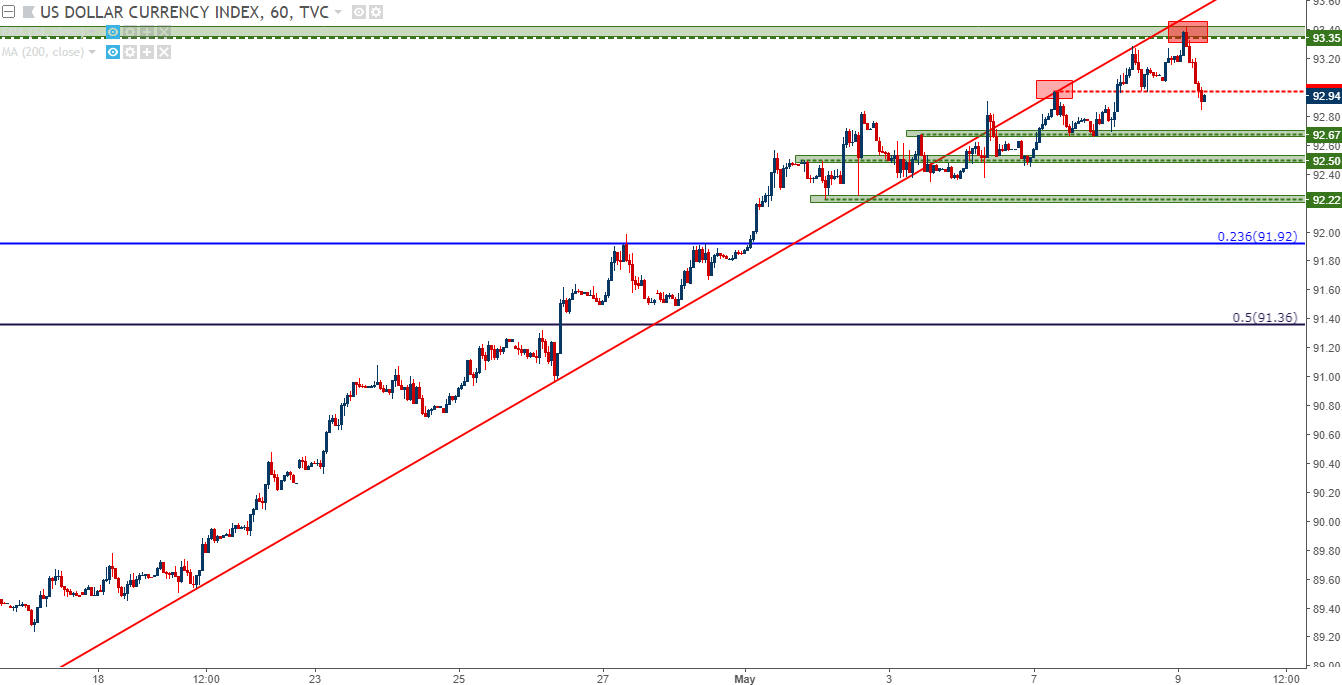
Chart prepared by James Stanley
EUR/USD Testing Trend-Line Resistance
In what’s probably been one of the biggest drivers to that Dollar move we have a rather concerted, albeit consistent sell-off that’s shown in the Euro over the past few weeks. This, of course, was hastened by an ECB meeting in latter-April, and that theme has pretty much stayed in the pressure cooker for much of the time since.
We looked at a few support levels earlier this week, and after a bit of pause in the trend showed around 1.1850, it was 1.1820 that helped the pair to firm-up as we approach tomorrow’s US inflation data. At this point, EUR/USD is testing trend-line resistance from what’s become a rather aggressive sell-off.
EUR/USD Hourly Chart: One-Way Down-Trend Tests Trend-Line Resistance
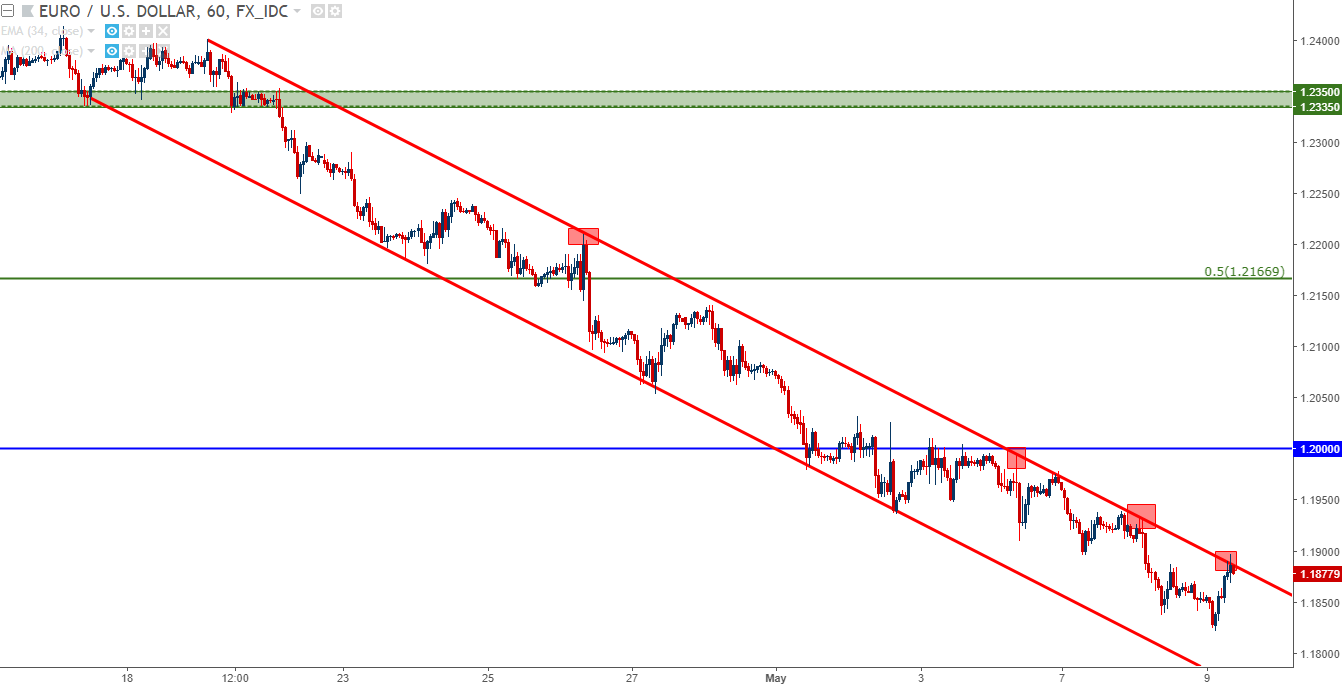
Chart prepared by James Stanley
GBP/USD Grinds at Key Support Ahead of BoE ‘Super Thursday’
Ahead of tomorrow’s CPI report out of the US, we have a Bank of England’s Super Thursday rate decision on the docket for Thursday morning. This is a meeting in which we’ll receive a rate decision and a press conference to go along with an updated Quarterly Inflation Forecast. The QIF is where we’ll likely see the predominant drive around Thursday’s rate decision, as expectations are no longer primed for a rate hike from the BoE tomorrow; instead looking deeper into 2018 after a recent slowdown in inflation.
As expectations for that rate hike were getting kicked further-out into the future, GBP/USD put in a rather aggressive reversal; after coming into April with a strong bullish breakout, the pair turned-around and erased all of that topside move and then some, quickly selling-off down to the March lows.
But when the 1.3500 level came into play on Friday of last week, interest began to build around reversal potential. The 1.3500 level has a bit of historical importance in GBP/USD, as this is around the swing-low from the Financial Collapse and this functioned as the pair’s low-water mark for more than eight years, until Brexit took place. Even after Brexit, this level came-in as a quick swing-high while prices were melting down; and when buyers were able to bring prices back a year later, this area became resistance. This is also confluent with the 50% retracement of the ‘Brexit move’ in the pair as this level resides at 1.3478, and given the oversold conditions that were showing on the Daily chart, we looked at a reversal setup in our FX setups of the week on Monday.
This could remain as one of the more attractive short-USD venues should that pullback in the Dollar continue to show.
GBP/USD Hourly Chart: Support Grind Around 1.3500
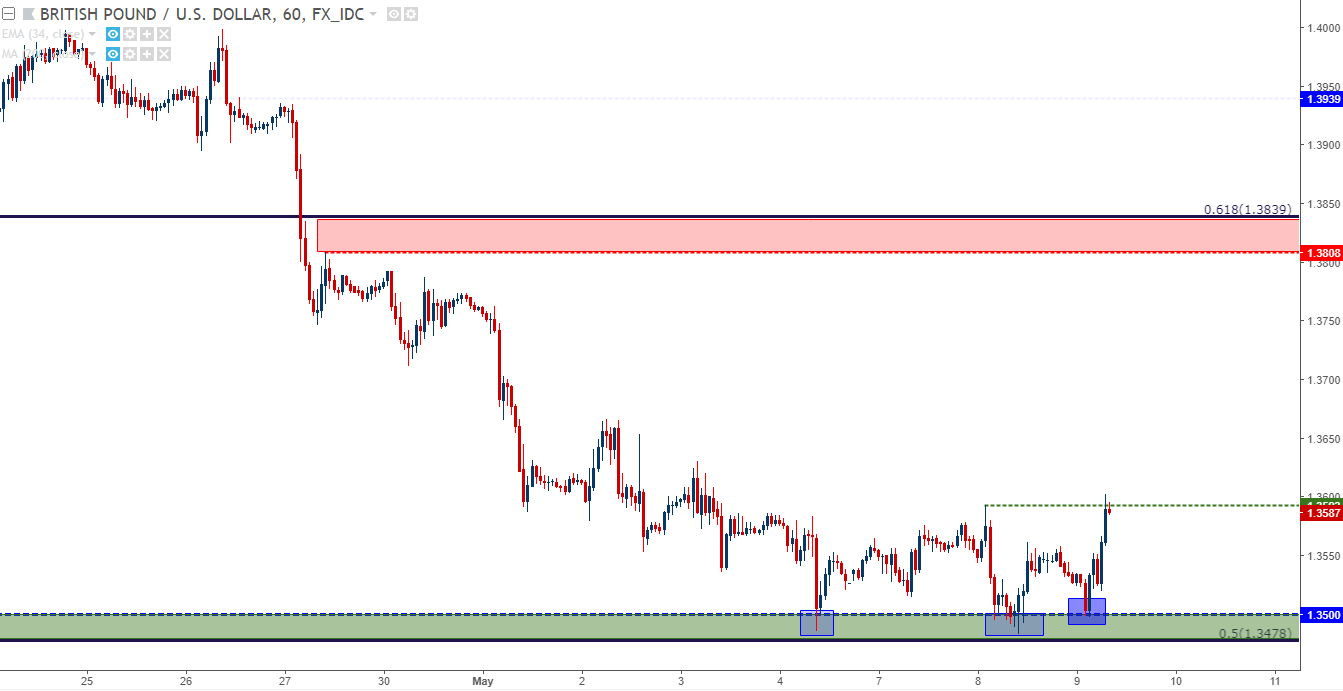
Chart prepared by James Stanley
NZD/USD: RBNZ on the Docket for Tonight
Before we get to tomorrow’s drivers, we have a rate decision out of the Reserve Bank of New Zealand. NZD/USD has been a big mover with that US Dollar theme of strength, and we looked at playing the short-side of a range in NZD/USD as Dollar-strength was starting to show up. That longer-term range led to a smooth scenario of short-term bearish momentum, but after prices fell below the .7000 psychological level, sellers haven’t been so aggressive. Will tonight’s RBNZ rate decision give them more reason to drive-lower?
At this stage, the longer-term range remains incomplete as prices have yet to test the support side of the formation that runs from .6820-.6870. We included this setup as part of our FX Setups of the Week for bullish-USD exposure, and if we are to see that move in the Greenback continue, the door remains open for a retest of values below the .6900 level on the pair.
NZD/USD Weekly Chart: Longer-Term Range Not Yet Complete
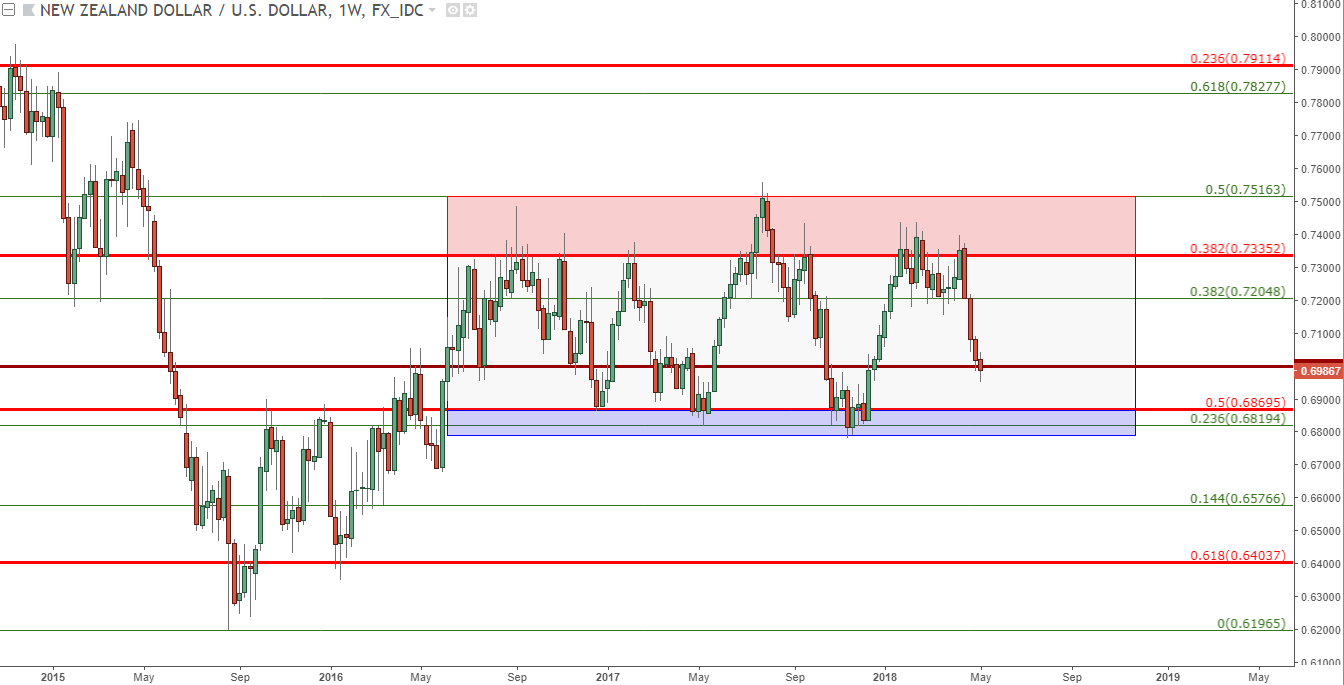
Chart prepared by James Stanley
After seeing a bit of grind around that .7000 level last week, prices posed a continuation move as we opened up this week; but sellers were unable to make much ground below the .6950 level. As we approach this evening’s RBNZ rate decision, prices are pulling back in a move that, at least at this point, appears to be driven by some element of bears squaring-up recent short-side exposure ahead of a big potential driver.
This exposes prior areas of resistance for short-side continuation; and if we do see a legitimate topside break around tonight’s rate decision with a sustained move back-above .7000, the door may soon re-open for topside exposure.
NZD/USD Hourly Chart: Pullback Towards .7000 Big Figure
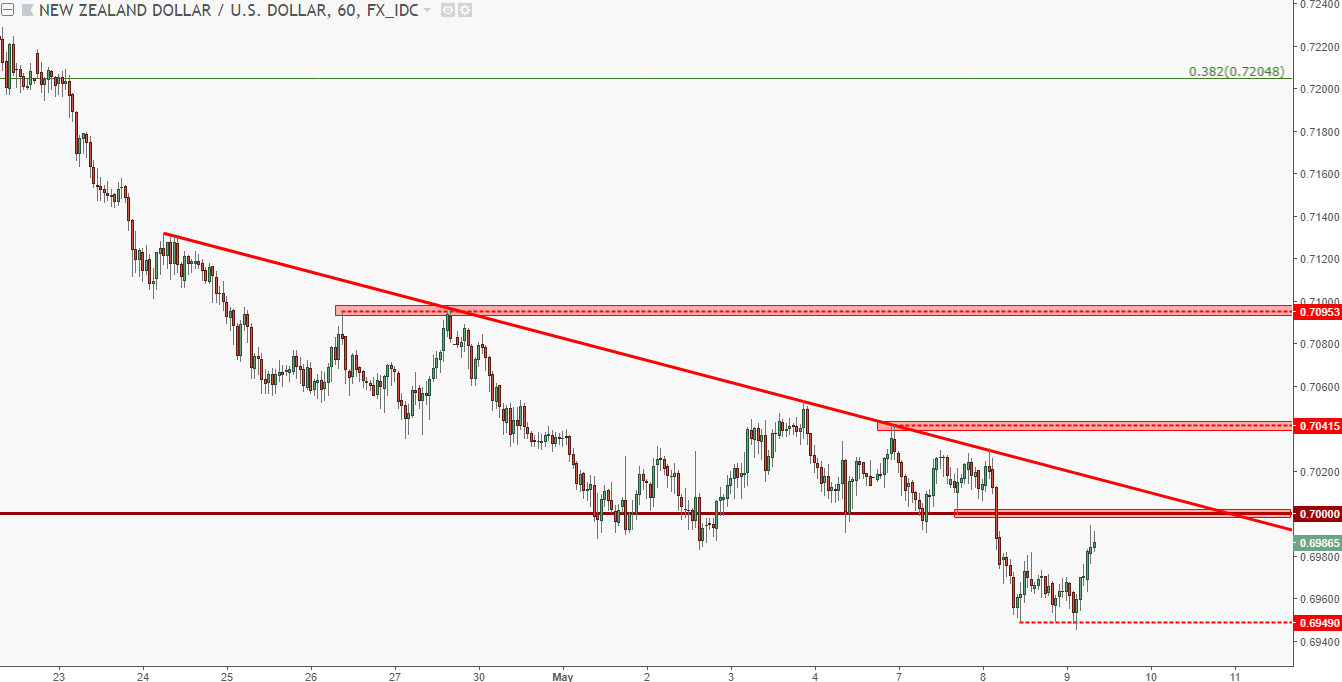
Chart prepared by James Stanley
To read more:
Are you looking for longer-term analysis on the U.S. Dollar? Our DailyFX Forecasts for Q1 have a section for each major currency, and we also offer a plethora of resources on USD-pairs such as EUR/USD, GBP/USD, USD/JPY, AUD/USD. Traders can also stay up with near-term positioning via our IG Client Sentiment Indicator.
Forex Trading Resources
DailyFX offers a plethora of tools, indicators and resources to help traders. For those looking for trading ideas, our IG Client Sentiment shows the positioning of retail traders with actual live trades and positions. Our trading guides bring our DailyFX Quarterly Forecasts and our Top Trading Opportunities; and our real-time news feed has intra-day interactions from the DailyFX team. And if you’re looking for real-time analysis, our DailyFX Webinars offer numerous sessions each week in which you can see how and why we’re looking at what we’re looking at.
If you’re looking for educational information, our New to FX guide is there to help new(er) traders while our Traits of Successful Traders research is built to help sharpen the skill set by focusing on risk and trade management.
--- Written by James Stanley, Strategist for DailyFX.com
To receive James Stanley’s analysis directly via email, please SIGN UP HERE
Contact and follow James on Twitter: @JStanleyFX


