


Talking Points:
- The British Pound is on the move this morning after a disappointing release of March inflation numbers. Inflation came in at 2.5% to mark the second consecutive month of slower price growth, and this helped to elicit a pullback in the British Pound. GBP/USD remains messy, although a cleaner setup may be available in GBP/JPY.
- US Equities continue to run higher, furthering the move after the bullish breakout earlier this week. We’re in the midst of earnings season out of the US, and that will continue into month-end; but on a bigger picture basis the concern is the increase in volatility that’s shown in the equity space so far this year. This highlights diminishing marginal impact of the ‘buy the dip’ strategy of old, and this urges caution for traders looking to take on bullish exposure whilst at or near short-term highs.
- DailyFX Forecasts have been updated for Q2, and are available from the DailyFX Trading Guides page. If you’re looking to improve your trading approach, check out Traits of Successful Traders. And if you’re looking for an introductory primer to the Forex market, check out our New to FX Guide.
Do you want to see how retail traders are currently trading the US Dollar? Check out our IG Client Sentiment Indicator.
UK Inflation Comes In Below Expectations
The early part of the week started with a bang in the British Pound as the currency surged up to fresh post-Brexit highs against the US Dollar. This was just ahead of March inflation numbers, and as we warned yesterday, chasing at those levels could be dangerous, and a pullback could very much be in order given how overbought the pair had become.
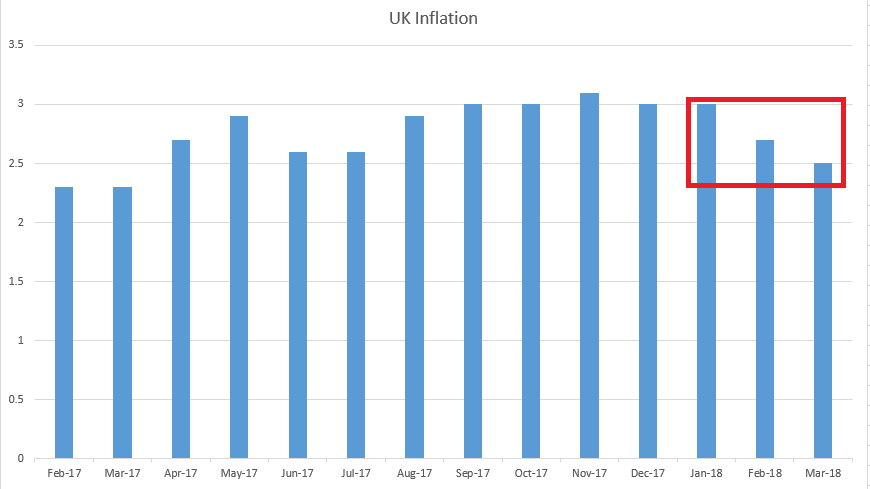
This morning’s inflation print out of the UK came out with disappointment. The expectation was for another 2.7% print as we had last month; but the actual print came out at 2.5%, marking for the second consecutive month of drawdown. This put a slight damper on probabilities for a May rate hike, although markets are still very much expecting 25 bps of tightening at that next Super Thursday event that is now just a few weeks away.
Inflation at 2.5% in March Marks Second Consecutive Month of Slower Price Growth
prepared by James Stanley
Pullback in the British Pound
Currency markets did not appear as calm as rate markets around this morning’s inflation miss, as the British Pound put in a stark reversal off of those fresh post-Brexit highs. The pullback began yesterday, and we looked at this in the webinar, plotting a series of potential support levels that may re-open the door for topside continuation. At this point, prices have moved through two of those potential support levels and it appears as though buyers are attempting to cauterize a low around the 1.4200 level. This would still be far too early to use for longer-term setups, as this may be a corrective move ahead of a deeper test towards 1.4145.
GBP/USD Hourly Chart: Pullback After Inflation Miss is Met With a Bounce

Chart prepared by James Stanley
GBP/JPY Pulls Back to Prior Fibonacci Resistance, Will Support Hold?
For topside plays in the British Pound, GBP/JPY may be a bit more attractive with our current backdrop. April has seen the theme of Yen-weakness slowly seep back into FX markets, and this could make for an attractive counterpart to match up with what could be a strong British Pound, given that the prevailing theme of strength remains through today’s pullback.
We’ve been following a level in GBP/JPY that has come into play this morning, and this level exists at 152.17. This is the 61.8% Fibonacci retracement of the February sell-off, and the 76.4% retracement of that same study helped to bring on resistance earlier this week. This was the first support level we looked at in yesterday’s webinar, and so far this is helping to hold this morning’s lows as prices have bounced by a little more than fifty pips at this point.
GBP/JPY Hourly Chart: Fibonacci Support at Prior Resistance

Chart prepared by James Stanley
S&P 500 Runs to Fresh April Highs
Over the past couple of weeks we’ve been following an area of resistance on the S&P 500 that started to give way on Monday. This resistance had become rather pent up, and we were looking for a topside breakout as bulls just would not give up. That bullish breakout continued through yesterday, crossing the 2700 level, and now the index is running towards the resistance level we’d looked at around 2724. This has been a fairly clean move given that there’s been very little pullback on the way up; but this might also be indicating that this rally is more of a squeeze-type of scenario as shorts cover while we move deeper into what’s been a rather strong earnings season thus far.
We’ll see a series of big names continuing to report through April, with a heavy emphasis on tech names next week and into the end of the month: Facebook reports earnings on April 25th, Google and Amazon on April 26th, and Apple reports on May the 1st.
Traders should be cautious around the long side of the move at this point, and we discussed a few of the reasons as to why in yesterday’s webinar. In short, equity volatility has taken on a different tone so far this year, and given the moves that we’ve seen in US rates markets, this could be a sign of a bigger correction on the horizon. The ‘buy the dip’ strategy that became so popular in the wake of the Financial Collapse appears to be bringing diminishing marginal returns, as often happens near the end of a trend, and if we do get another revisit to the 2530-2550 area on the S&P 500, we may not have such a strong response at support.
S&P 500 Rallies to Fresh April Highs, But Bigger-Picture Corrective Move Remains a Possibility
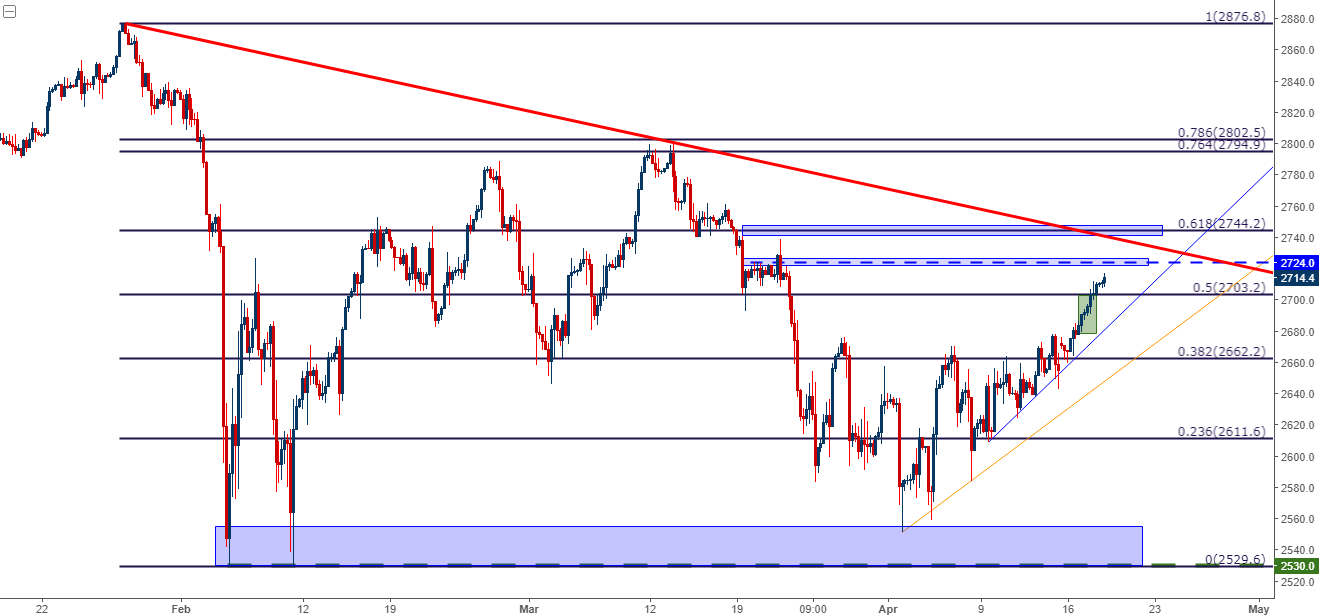
Chart prepared by James Stanley
On the daily chart of the S&P 500, we can see where a wedge has started to form with the lower-highs of 2018 being coupled with the prior bullish trend-line that draws back to the summer of 2016. We’ve also added 21-period Average True Range to help illustrate the pickup in volatility that we’ve seen thus far this year. This begs the question: Have we already seen the 2018 high in the S&P 500?
S&P 500 Daily Chart: Lower-Highs, Pickup in Volatility Highlight Topping Potential
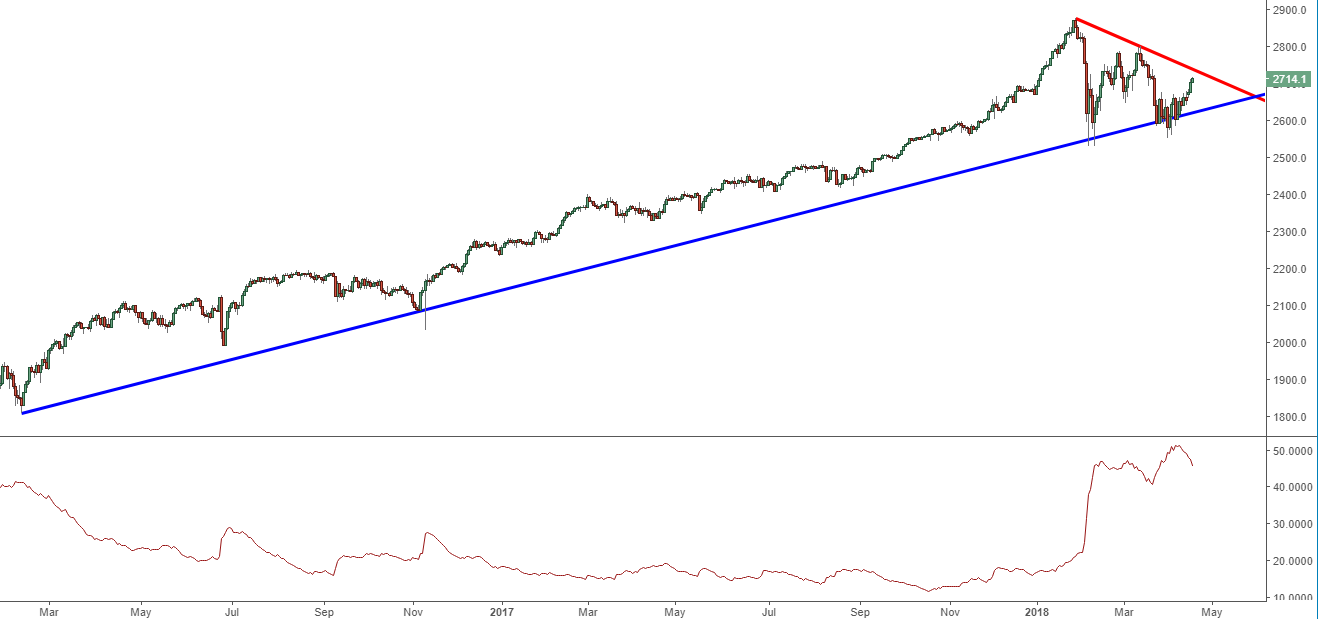
Chart prepared by James Stanley
USD/JPY Builds into a Bullish Channel
This is a shorter-term observation, but given the potential impact for longer-term trends, its worthy of mention. USD/JPY has built-in to a short-term bullish channel, and this may be highlighting a return of Yen-weakness after a stark show of strength in February and March. We’ve been following the bullish reversal in USD/JPY as Yen-weakness has started to show up, and yesterday we focused-in on a hit of support at prior resistance around 106.61. Since then – we’ve seen bulls continuing to bid at higher lows, and this could be further evidence of a potential return of Yen-weakness.
USD/JPY Hourly Chart: Build of Bullish Channel
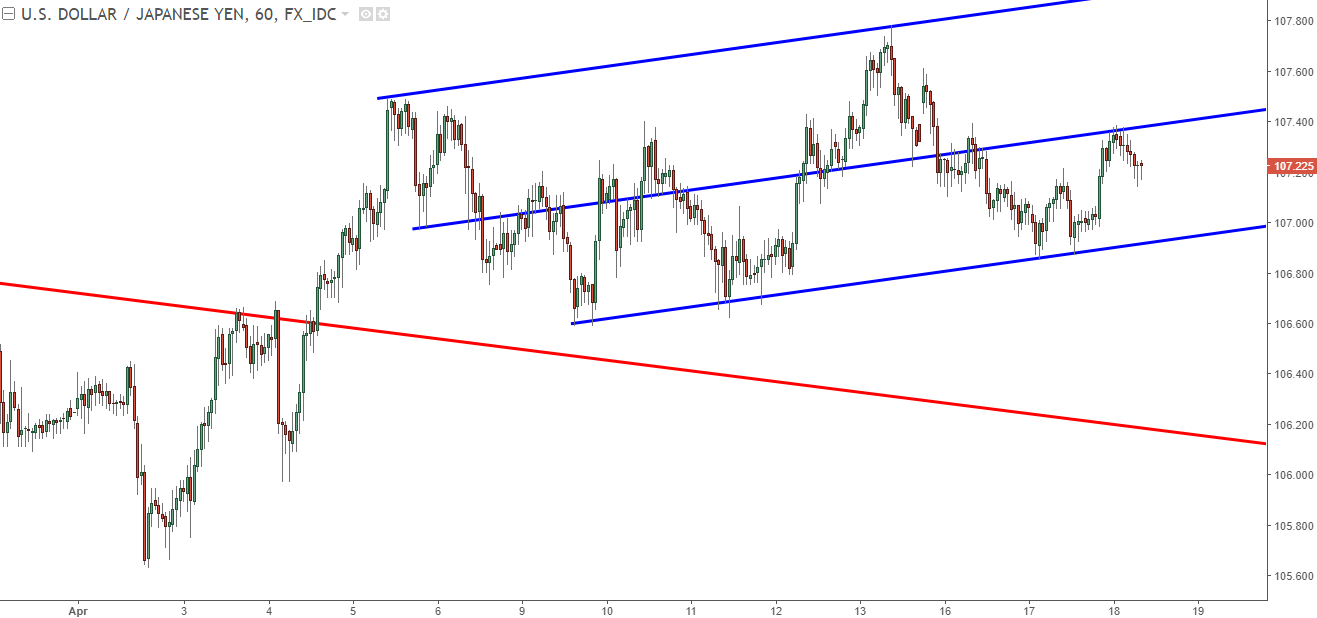
Chart prepared by James Stanley
The US Dollar may be a lackluster counterpart to work with that theme. Given the aggressive downtrend that’s shown in the US currency over the past year, traders may be best served by looking to marry-up a potentially weak Yen with another currency that may show a more consistent stream of strength. We looked at GBP/JPY above, and that remains a viable option, but also on the table is EUR/JPY, as we’ve been following over the past week. So far in April, price action has climbed above a key zone of support/resistance that runs from 131.43 up to 132.05. This zone had helped to support the pair through the final few months of last year, and this area became resistance after the reversal in February. After a month of churn through March, prices have climbed back-above this price, making for a case of support at prior resistance which was previous support.
EUR/JPY Daily Chart: Support at Prior Resistance that Was Previous Support
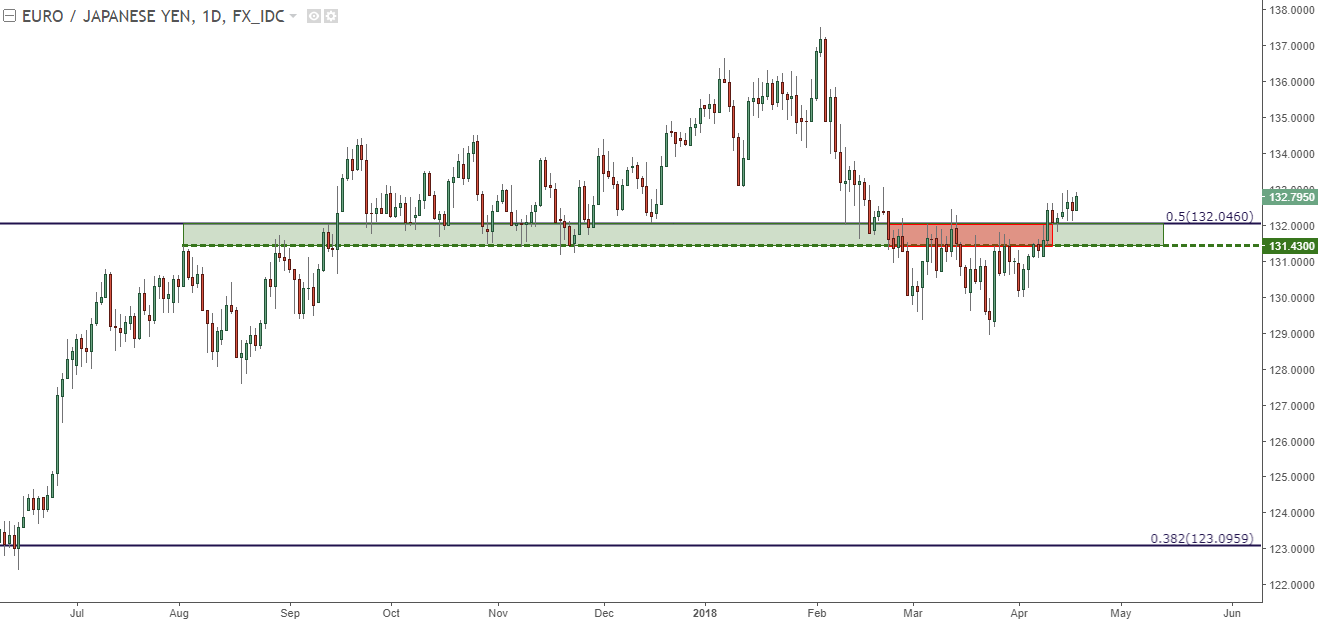
Chart prepared by James Stanley
To read more:
Are you looking for longer-term analysis on the U.S. Dollar? Our DailyFX Forecasts for Q1 have a section for each major currency, and we also offer a plethora of resources on USD-pairs such as EUR/USD, GBP/USD, USD/JPY, AUD/USD. Traders can also stay up with near-term positioning via our IG Client Sentiment Indicator.
Forex Trading Resources
DailyFX offers a plethora of tools, indicators and resources to help traders. For those looking for trading ideas, our IG Client Sentiment shows the positioning of retail traders with actual live trades and positions. Our trading guides bring our DailyFX Quarterly Forecasts and our Top Trading Opportunities; and our real-time news feed has intra-day interactions from the DailyFX team. And if you’re looking for real-time analysis, our DailyFX Webinars offer numerous sessions each week in which you can see how and why we’re looking at what we’re looking at.
If you’re looking for educational information, our New to FX guide is there to help new(er) traders while our Traits of Successful Traders research is built to help sharpen the skill set by focusing on risk and trade management.
--- Written by James Stanley, Strategist for DailyFX.com
To receive James Stanley’s analysis directly via email, please SIGN UP HERE
Contact and follow James on Twitter: @JStanleyFX


