


Talking Points:
- We’ve been following the breakdown of the prior bullish trend in EUR/JPY, and the pair is now finding resistance at a zone of prior support. This keeps the door open for short-side strategies, and an analyst pick was just published around this setup in the article entitled, Bearish EUR/JPY with Deeper Breakdown Potential.
- EUR/JPY continues to show bearish tonalities, and this may be a more attractive pair for short-side Euro strategies as the US Dollar faces a couple of key drivers over the next two weeks with inflation data and a widely-expected rate hike next Wednesday.
- If you’re looking to improve your trading approach, check out our Traits of Successful Traders research. And if you’d like more of a basic primer for the FX market, check out our New to FX Guide.
To receive James Stanley’s Analysis directly via email, please sign up here
Reversing the Reversal: Strength to Weakness and Back to Strength
The first quarter of this year was a rocky period for EUR/JPY. While the pair came into the year with a stream of strength that had largely continued for most of last year, prices began to reverse in February and continued to sell-off as we moved into quarter-end. Playing a key role in this reversal was a zone of support from Q4 of last year. This zone runs from 131.43 up to the 50% Fibonacci retracement of the 2008-2012 major move in the pair. This area had helped to hold support in EUR/JPY from September of 2017 into February of 2018; and when prices finally did break below in mid-February, resistance began to show off of this area of prior support.
EUR/JPY Daily Chart: Prior Support Zone Becomes Resistance in February-March
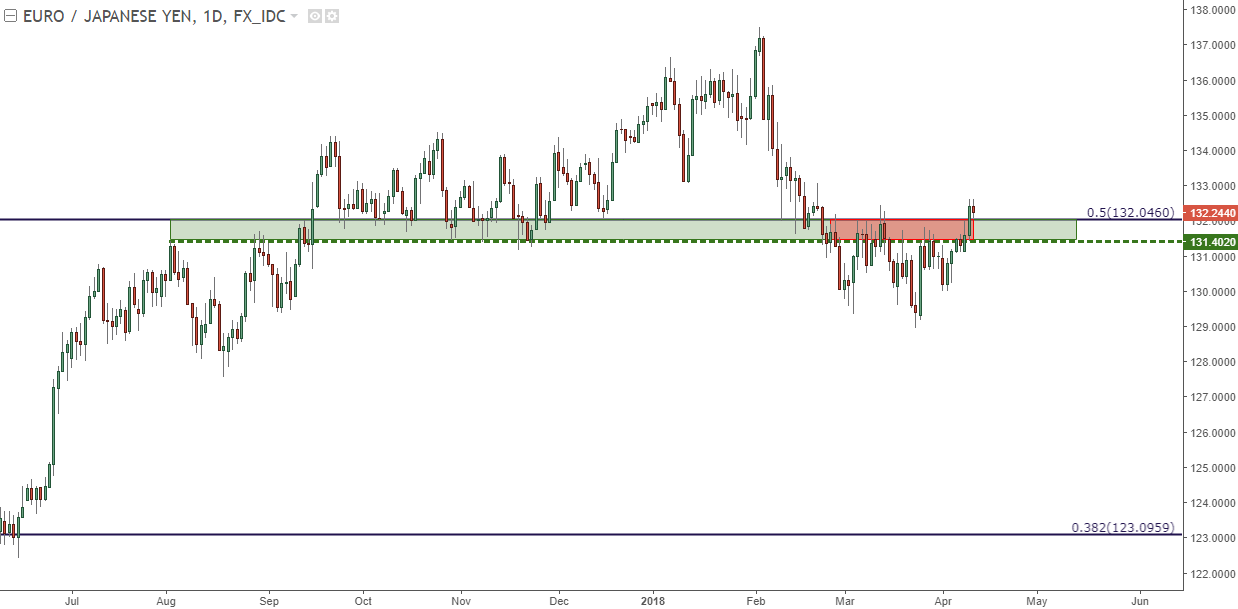
Chart prepared by James Stanley
The support zone from 131.43-132.05 did not give up quietly, as we had a rather pensive churn around this area as prices were breaking-lower, and bulls continued to push prices back up to this zone on subsequent breaks, helping that area of support to show as resistance in late-February and for a large portion of the month of March.
Prices nudged down to a fresh five-month low as we neared the final week of March, and at that point we asked if bears were finished. An outsized bullish reaction pushed prices right back up to resistance; and while buyers weren’t quite ready to take over yet, that door was starting to open. We looked at a short-side EUR/JPY setup as we neared the March close, and after a quick visit to the target, prices quickly reversed and have since continued to rally up to a fresh six week high.
On the four-hour chart below, we have two trend-lines: In red, we have the bearish trend-line that helped to govern that support break in February and March. And in Blue, we have the newer bullish trend-line that’s started to show in April price action.
EUR/JPY Four-Hour Chart: Bullish Move Begins in April, Breaks Above Resistance
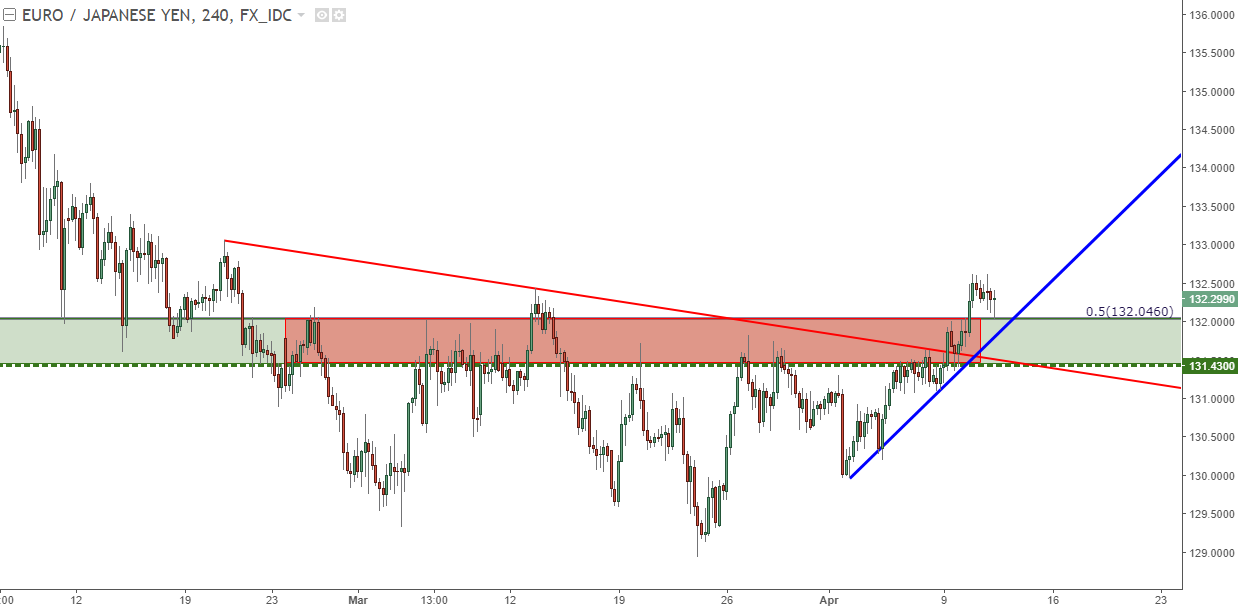
Chart prepared by James Stanley
Over the past two trading days, prices have broken back-above that prior support/resistance area as we rallied up to fresh six-week highs at 132.61. Prices have pulled back this morning, and we’ve seen a bullish reaction off the 132.05 area, highlighting the potential for topside continuation in the pair. On the hourly chart below, we’re focusing in on this recent move of strength, looking to the structure of higher-highs and higher-lows to plot the probabilities of continuation. If prices break back-below the 130.00 psychological level, the bullish theme is nullified, at least in the short-term, as a re-test of the 129.00 low would appear likely. Outside of that, support showing at either 131.62 or 131.11 could keep the bullish side of EUR/JPY as attractive as focus shifts towards higher-highs and higher-lows.
EUR/JPY Hourly Chart: Higher-Highs, Lows Create Bullish Structure
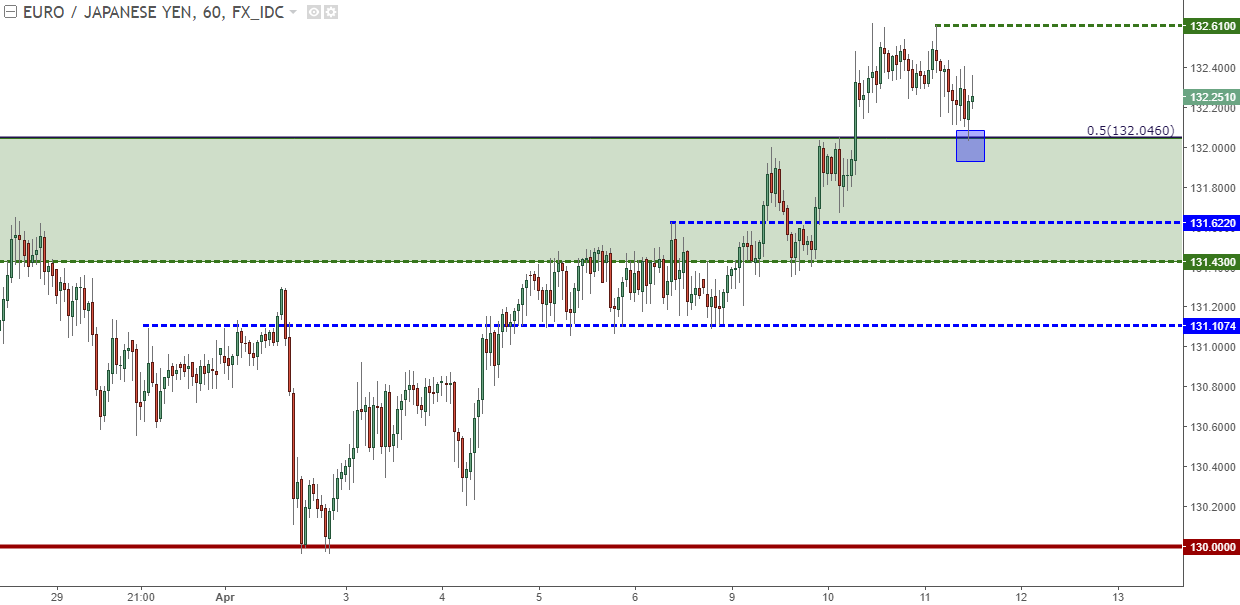
Chart prepared by James Stanley
To read more:
Are you looking for longer-term analysis on the Euro or Japanese Yen? Our DailyFX Forecasts for Q1 have a section for both EUR/USD and USD/JPY. We also offer a plethora of resources on our EUR/JPY page, and traders can stay up with near-term positioning via our IG Client Sentiment Indicator.
Forex Trading Resources
DailyFX offers a plethora of tools, indicators and resources to help traders. For those looking for trading ideas, our IG Client Sentiment shows the positioning of retail traders with actual live trades and positions. Our trading guides bring our DailyFX Quarterly Forecasts and our Top Trading Opportunities; and our real-time news feed has intra-day interactions from the DailyFX team. And if you’re looking for real-time analysis, our DailyFX Webinars offer numerous sessions each week in which you can see how and why we’re looking at what we’re looking at.
If you’re looking for educational information, our New to FX guide is there to help new(er) traders while our Traits of Successful Traders research is built to help sharpen the skill set by focusing on risk and trade management.
--- Written by James Stanley, Strategist for DailyFX.com
To receive James Stanley’s analysis directly via email, please SIGN UP HERE
Contact and follow James on Twitter: @JStanleyFX


