


In this webinar, we used price action to look at macro markets after the bullish breakouts that showed in the early portion of this week in GBP/USD and the S&P 500. While each of these moves have different drivers and characteristics, USD-weakness played a role in each. This has went hand-in-hand with a short-term bearish move in the US Dollar and this opens up the possibility of more downside in the Greenback as we move deeper into this week.
Talking Points:
- If you’re looking to improve your trading approach, our Traits of Successful Traders research could help. This is based on research derived from actual results from real traders, and this is available to any trader completely free-of-charge.
- If you’re looking for a primer on the FX market, we can help. To get a ground-up explanation behind the Forex market, please click here to access our New to FX Trading Guide.
If you’d like to sign up for our webinars, we host an hour-long event on Tuesday and Thursday, each of which can be accessed from the below links:
Tuesday: Tuesday, 1PM ET
Thursday: Thursday 1PM ET
S&P Bullish Breakout into Resistance
We started off by looking at the S&P 500 after this morning’s bullish breakout. Prices had spent much of the past three weeks building into an ascending wedge pattern, and resistance began to give way yesterday and that strength has lasted into today. We were looking for a move into 2703, or the 50% retracement of the February sell-off, and that’s already taken place. The big question now is one of continuation potential, and we looked at a few bullish trend-lines to illustrate how this recent topside breakout has displayed an increasing and likely unsustainable pace of gains. We looked at a few resistance levels to begin plotting short-side setups in the S&P 500, with possible areas of interest at 2724 and 2744.
S&P 500 Hourly Chart: An Unsustainable Increase in the Pace of Gains Runs into Resistance

Chart prepared by James Stanley
USD – Intermediate-Term Range with Bearish Short-Term Trend Potential
We looked at the Dollar from a couple of different perspectives: On the four-hour and above the range that’s been in place since January remains. But – on a shorter-term basis, there are signs of trend, as we’ve seen sellers take-over after the NFP report earlier in the month, and that move has continued with lower-lows and lower-highs, all the way into this morning’s trade. This keeps the door open for short-term bearish continuation, targeting the March lows at 89.00 in DXY.
US Dollar via ‘DXY’ Hourly Chart: Lower-Lows, Lower-Highs

Chart prepared by James Stanley
EUR/USD Remains in Range
Going along with that range-bound behavior in USD, we have the well-built range in EUR/USD. On a shorter-term basis, longs could be justified if prices pull back a bit closer to 1.2300, which had helped to set last week’s swing lows. Outside of that, be careful of resistance at 1.2400-and-above.
GBP/USD Bullish Breakout Pulls Back
It’s been fireworks in the British Pound so far in April, as the pair was testing the 1.4000 level around the NFP report no more than two weeks ago and we’ve already moved up to a fresh post-Brexit high earlier this morning. After that high came in, however, a reversal started to show, as indicated by a bearish pin bar off the failed test at that high. Prices have already pulled back to the ‘s1’ level that we looked at earlier this morning at 1.4285. This is the 76.4% retracement of the ‘Brexit move’ in the pair, and this could be used by those looking to take an aggressive stance on continuation. More proactive for longer-term stances could be deeper support at 1.4245 or, perhaps even 1.4200.
GBP/USD Hourly Chart: Pullback After Bullish Breakout Sets Fresh Post-Brexit Highs
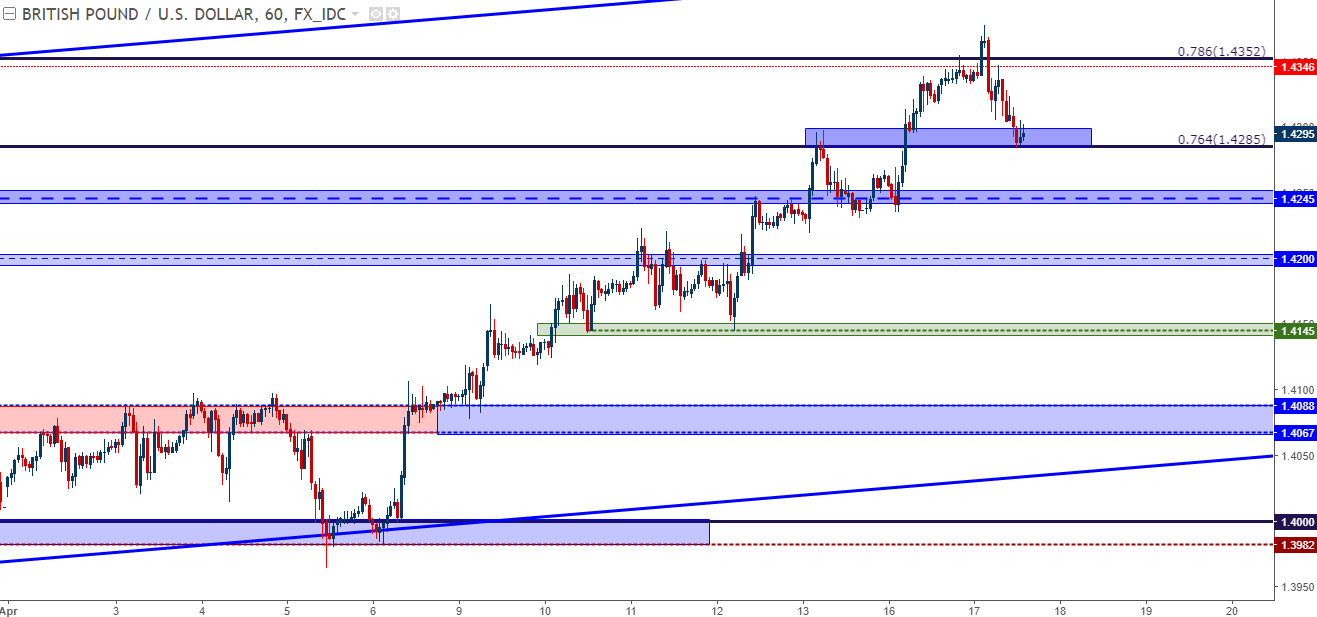
Chart prepared by James Stanley
AUD/USD Holds Resistance
Over the past couple of weeks we’ve been looking for resistance in AUD/USD, and the zone of interest has been between .7750-.7780. Prices actually broke out of this zone last week, albeit temporarily, as bears pushed right back, and we’ve seen had a build of lower-high resistance on recurrent tests around .7780. We looked at how a bearish test below .7750 re-opens the door to short-side continuation in the pair.
AUD/USD Hourly Chart: Build of Lower-Highs Keeps Door Open for Shorts

Chart prepared by James Stanley
NZD/USD Moving Below Resistance Opens Door for Shorts
We’ve been following the longer-term range in NZD/USD for the past couple of months, waiting for prices to show a bearish short-term move, indicating that the longer-term range may be nearing its next leg-lower. Earlier today saw prices pose a bearish move through .7335, and this keeps the door open for short-side setups. We looked at a series of resistance levels that could be usable for short-side NZD/USD setups.
NZD/USD Hourly Chart: Lower-Lows, Highs as Prices Trade Through ST Support, LT Resistance

Chart prepared by James Stanley
USD/JPY: Decision Time for Bulls
We looked at the construction of shorter-term USD/JPY themes, and the door remains open for bullish continuation, as we’ve seen a build of higher-lows above points of resistance from last month. The issue at the moment appears to be bulls unwillingness to drive beyond resistance, as we haven’t yet been able to test the swing-high at 107.90. The long side of the pair brings the unattractive option of long-USD exposure in order to take on short-Yen. We looked at a couple of other setups that may be a bit more attractive for that same theme.
USD/JPY Four-Hour Chart: Bulls Attempting to Make a Stand at Higher-Low

Chart prepared by James Stanley
GBP/JPY
This pair has put in a very bullish move over the past few weeks, and that’s largely continued into this morning. The pair has recently started to shy away from the Friday high around the 153.87 Fibonacci level, and this may be preluding a deeper retracement. We looked at possible higher-low support around 152.17 and 151.39.
GBP/JPY Four-Hour Chart: Unable to Take out 76.4% Fibonacci Resistance
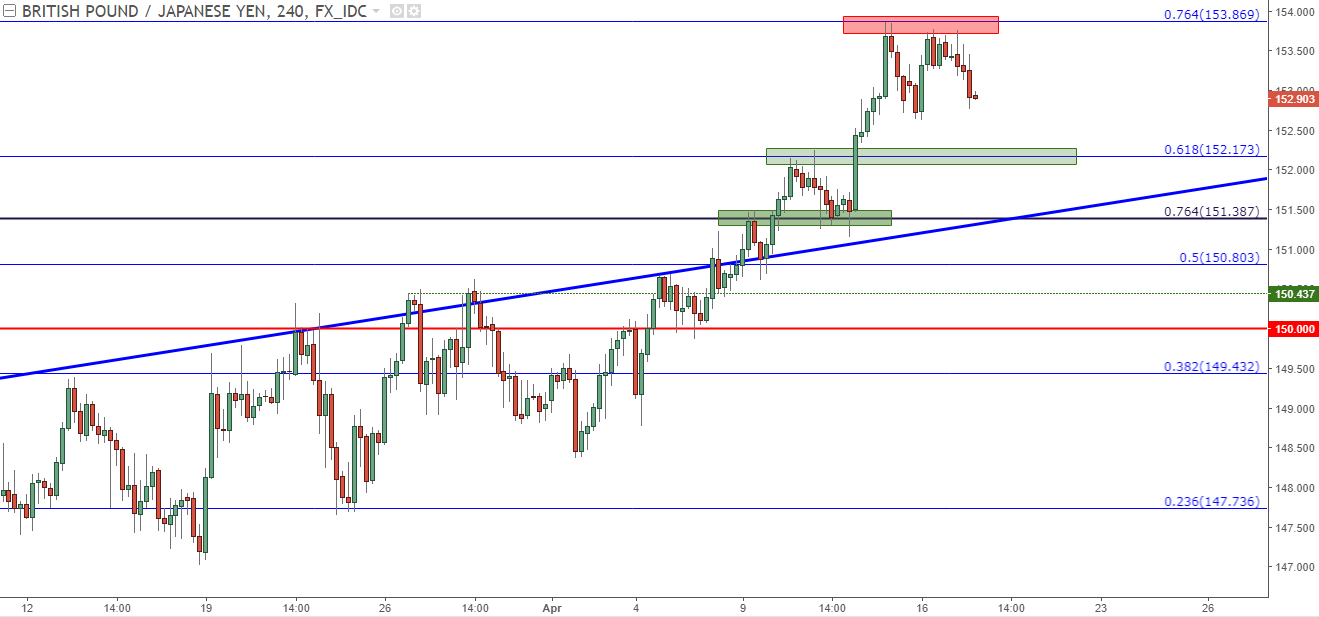
Chart prepared by James Stanley
EUR/JPY: Support at Prior Resistance Which Was Previous Support
This is one of our FX Setups for this Week, and the door remains open to bullish continuation. We’ve seen a continuation of support around the Fibonacci level at 132.05, and this area had spent most of March as resistance after helping the pair to find support for the final four months of last year.
EUR/JPY Daily Chart: Re-Claims Support Zone, But Can Bulls Hold the Line?
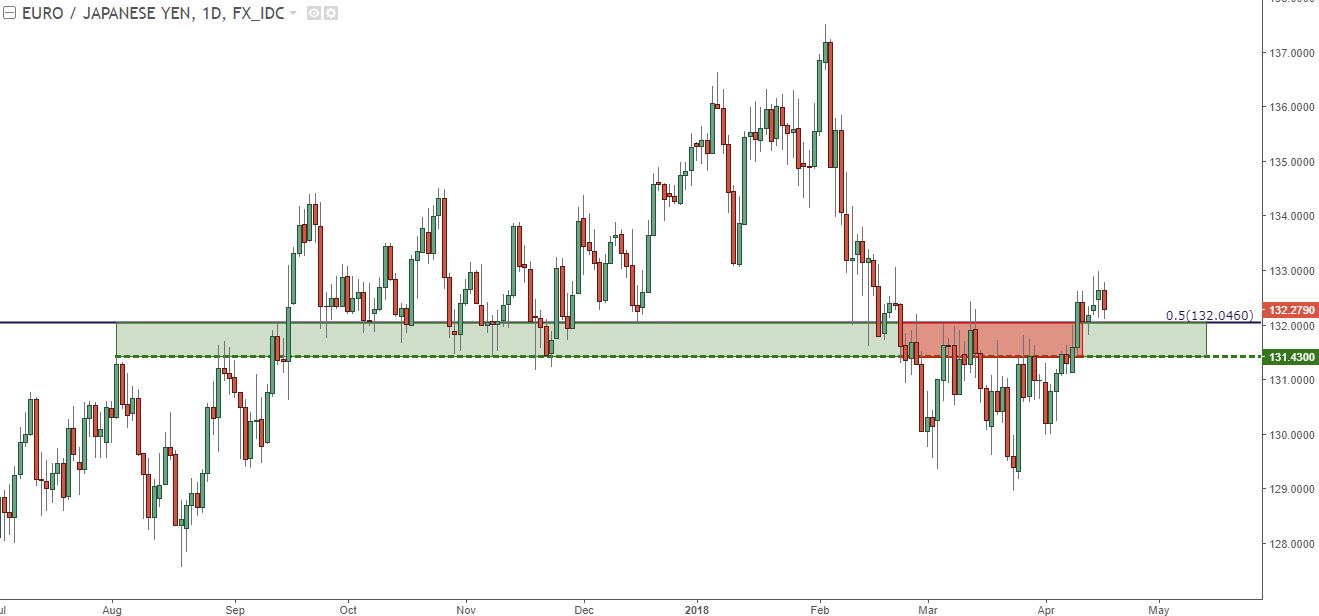
Chart prepared by James Stanley
To read more:
Are you looking for longer-term analysis on the U.S. Dollar? Our DailyFX Forecasts for Q1 have a section for each major currency, and we also offer a plethora of resources on USD-pairs such as EUR/USD, GBP/USD, USD/JPY, AUD/USD. Traders can also stay up with near-term positioning via our IG Client Sentiment Indicator.
Forex Trading Resources
DailyFX offers a plethora of tools, indicators and resources to help traders. For those looking for trading ideas, our IG Client Sentiment shows the positioning of retail traders with actual live trades and positions. Our trading guides bring our DailyFX Quarterly Forecasts and our Top Trading Opportunities; and our real-time news feed has intra-day interactions from the DailyFX team. And if you’re looking for real-time analysis, our DailyFX Webinars offer numerous sessions each week in which you can see how and why we’re looking at what we’re looking at.
If you’re looking for educational information, our New to FX guide is there to help new(er) traders while our Traits of Successful Traders research is built to help sharpen the skill set by focusing on risk and trade management.
--- Written by James Stanley, Strategist for DailyFX.com
To receive James Stanley’s analysis directly via email, please SIGN UP HERE
Contact and follow James on Twitter: @JStanleyFX


