


Talking Points:
- This morning’s inflation report out of the United States saw fresh one-year highs in both headline and core CPI. This is now the seventh consecutive month of headline CPI coming-in at the Fed’s 2% target or higher, while Core CPI has crossed the 2% marker for the first time in the past 12 months. This inflation strength has helped the US Dollat to finally find some element of support after the sell-off that started around last week’s disappointing NFP report.
- The US Dollar has been in a consistent sell-off since that NFP report, and on a short-term basis that move has become oversold. A pullback here could be helpful for USD bears, as this could help to alleviate that oversold condition while also pushing prices back towards lower-high resistance. We look at a series of levels that’s interesting for such a scenario.
- Are you looking to improve your trading approach? Check out Traits of Successful Traders. And if you’re looking for an introductory primer to the Forex market, check out our New to FX Guide.
Do you want to see how retail traders are currently trading the US Dollar? Check out our IG Client Sentiment Indicator.
From Provocative Tweets to US Inflation
It’s already been a busy morning already as the US session gets underway, as the day opened with some rather provocative tweets that appeared to carry pull across global markets; and this led into the CPI release of March inflation numbers out of the United States. A little later today we’ll get the meeting minutes from last month’s rate decision at the Fed, and this should be interesting given the fact that we a) received a rate hike and b) the Fed appeared very close to expecting three additional hikes in 2018 versus the two that they’re now looking for. Today’s meeting minutes can shed some light on what exactly might push the bank towards the expectation for three additional hikes in the remainder of this year.
Headline Inflation Prints In-Line at 2.4% For Strongest CPI Read in a Year
This morning brought the release of March inflation numbers out of the US, and there was little by way of excitement despite the fact that both came-in at one-year highs; as both headline and core CPI printed in-line with expectations. Headline CPI came in at 2.4%, and this is the strongest read that we’ve seen since March of last year. This is also the seventh consecutive month that headline inflation has come in at the Fed’s 2% target or higher.
US CPI Prints at One-Year High, Seventh Consecutive Month At-or-Above the Fed’s 2% Target
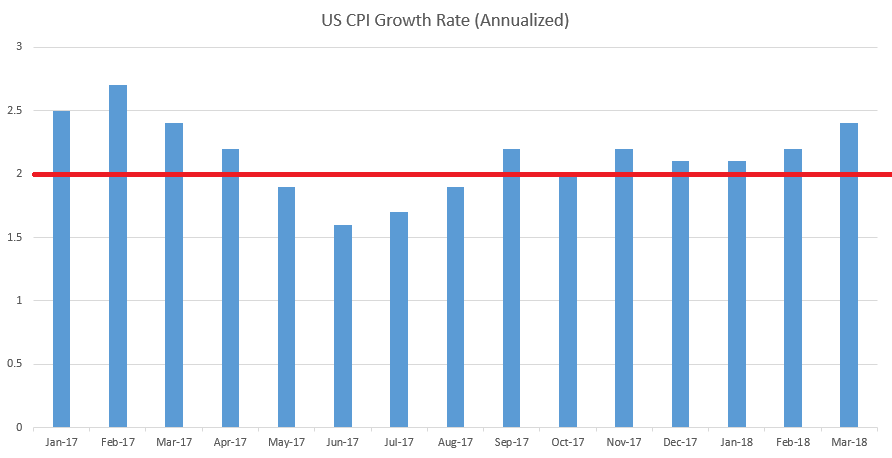
Chart prepared by James Stanley
Core Inflation Also at One-Year Highs
A common explanation for why the US Dollar might not see strength on continued inflation above the Fed’s target has been the lag in core inflation, as we’ve basically spent the entirety of the past year below 2%. This morning saw the first read of Core CPI above 2% since last year, and this breaks a pattern that’s seen that data point oscillate between 1.7 and 1.8% for the past 11 months.
Core CPI Prints at One-Year Highs, Crossing 2%

Chart prepared by James Stanley
US Dollar Fails to Rally on CPI Strength
Much as we’ve seen play out time and again over the past year, seemingly bullish factors around the US Dollar have failed to inspire any element of significant strength. Yesterday, we looked at the US Dollar turning-around after last week’s NFP report, and that weakness has largely continued as the Dollar has sold-off thus far in the early part of the week. We’ve moved down by more than one-percent in the Greenback from the highs that were set last Friday morning, just ahead of that disappointing NFP report.
This would allude to the fact that there’s something else doing the pushing here; and we’ve previously discussed to the prospect of a greater pull of weakness around fiscal policy that’s at least partially off-setting these positive USD-factors.
At this point, prices in the US Dollar are holding on to the bottom of the support zone that we looked at yesterday, and this runs around a batch of prices that had helped the Greenback to find support for the first part of March.
US Dollar via ‘DXY’ Four-Hour Chart: Finding Support at Bottom of the Zone
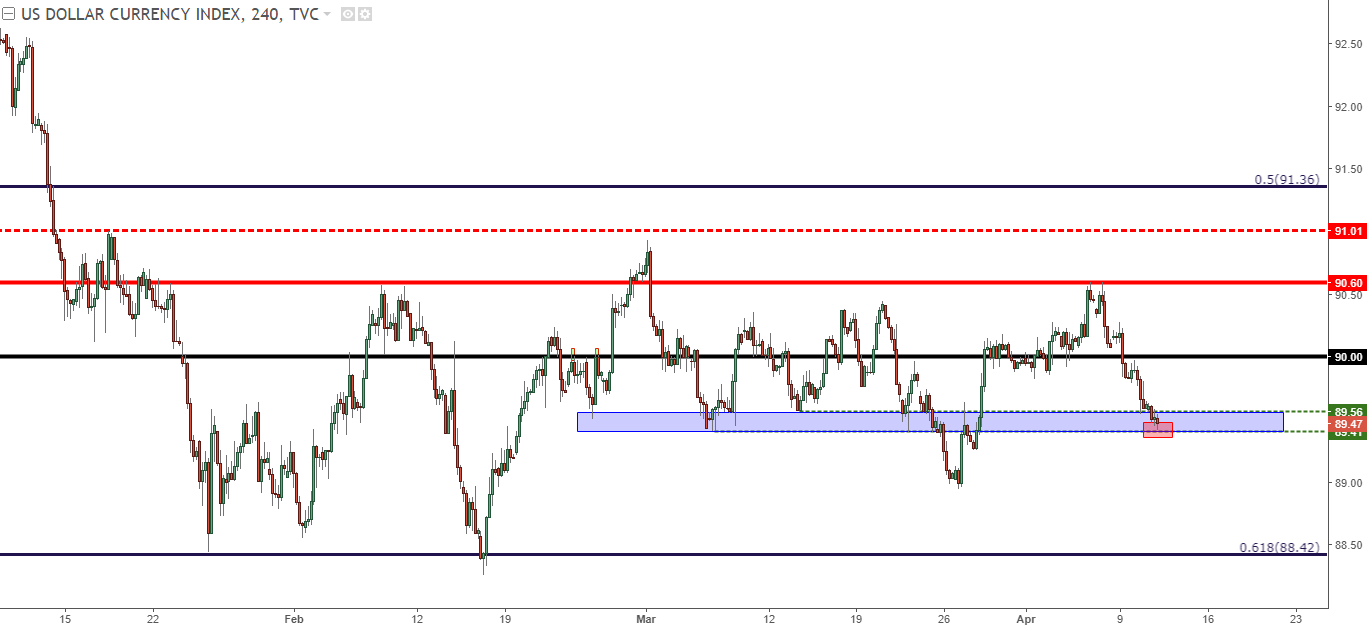
Chart prepared by James Stanley
On a shorter-term basis, the big question is whether or not the Dollar is able to carve out some support today. The Greenback has been on a consistent course-lower since last Friday’s NFP report, and the case can be made that the move is oversold on a near-term basis. RSI has been diverging on the hourly chart over the past day, and this is something that can urge caution on short-side continuation setups while we’re in this intermediate-term support zone.
This oversold nature of the near-term trend, combined with the strength in this morning’s inflation report – may open the door for a short-term pullback in the Greenback. On the below chart, we’re looking at a series of potential resistance levels that can open the door for lower-highs in USD/DXY.
US Dollar Hourly Chart: Diverging RSI Highlights Oversold Nature of Short-Term Move
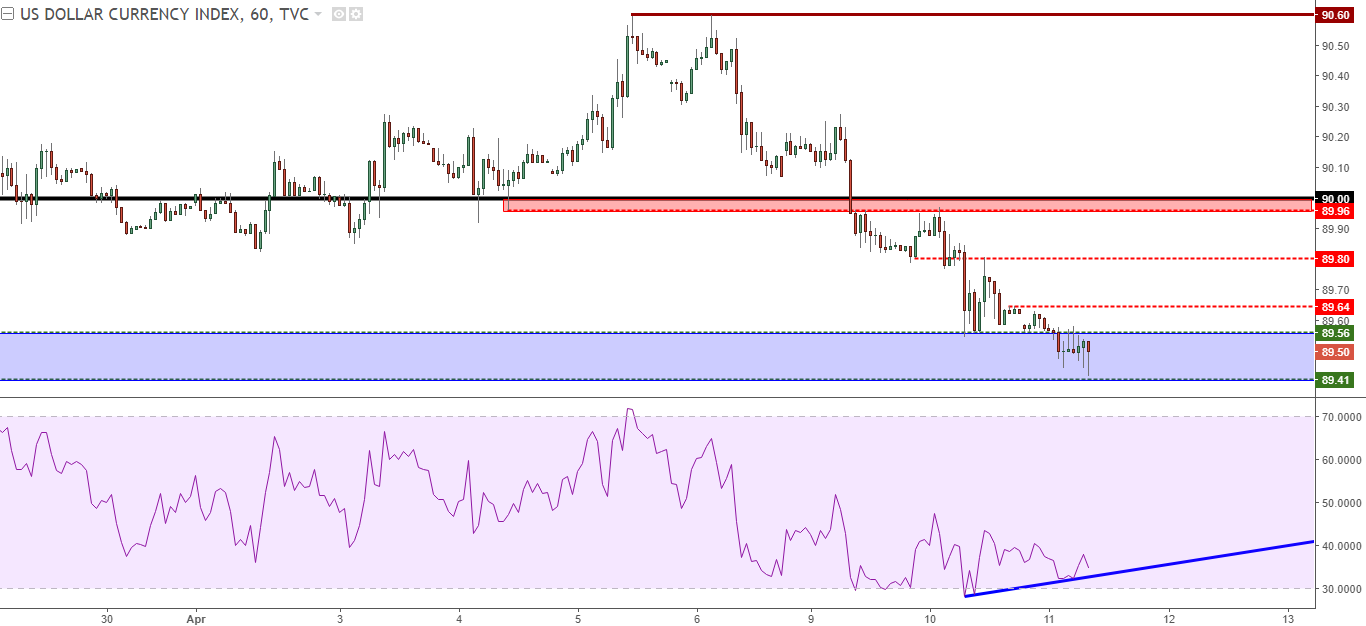
Chart prepared by James Stanley
Strategy Around the US Dollar
Given that we have a backdrop that could bring about a retracement in this down-trend, the door opens for a variety of setups. We looked into a number of these yesterday in the webinar, US Dollar Price Action Setups Ahead of CPI, FOMC Minutes; and many of those setups remain as work-able. We go over updates below, along with some areas of interest to watch for as we move deeper into today’s trade.
EUR/USD – Prior Short-Term Resistance as Next Support?
On the short-side of the US Dollar, there are probably few markets or pairs that will generate as much interest as what we have in EUR/USD. Unfortunately, matters there remain as rather unexciting as the pair remains in a range that’s built-in with a fair bit of consistency since those fresh three-year highs in January. We looked at support last week around the mid-March swing lows, and we’re now tip-toeing up to a zone of resistance that’s twice turned around bullish advances since the beginning of last month. The area around 1.2375 appears to be exhibiting some strong short-term resistance, and this could be a hindrance to bullish continuation strategies.
EUR/USD Four-Hour Chart: Resistance Shows Ahead of March Highs
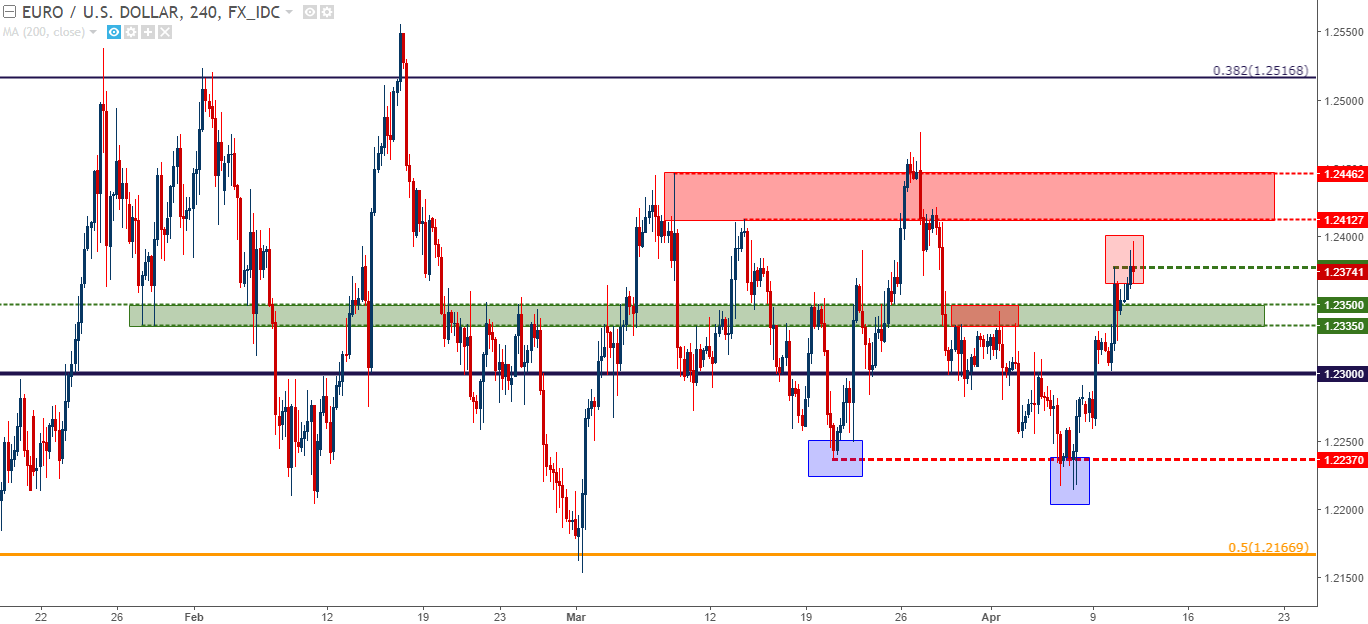
Chart prepared by James Stanley
Drilling down to the hourly chart will help to illustrate how pensive this situation around resistance has been so far on the morning, as we’ve seen a series of dojis print on the hourly since the Euro session got underway. This would make the prospect of chasing the move at this point daunting, and for those looking to take on long exposure, that zone of prior support/resistance from 1.2335-1.2350 becomes interesting for bullish continuation scenarios.
EUR/USD Hourly Chart: Resistance Shy of 1.2400 Puts Focus for Support 1.2335-1.2350
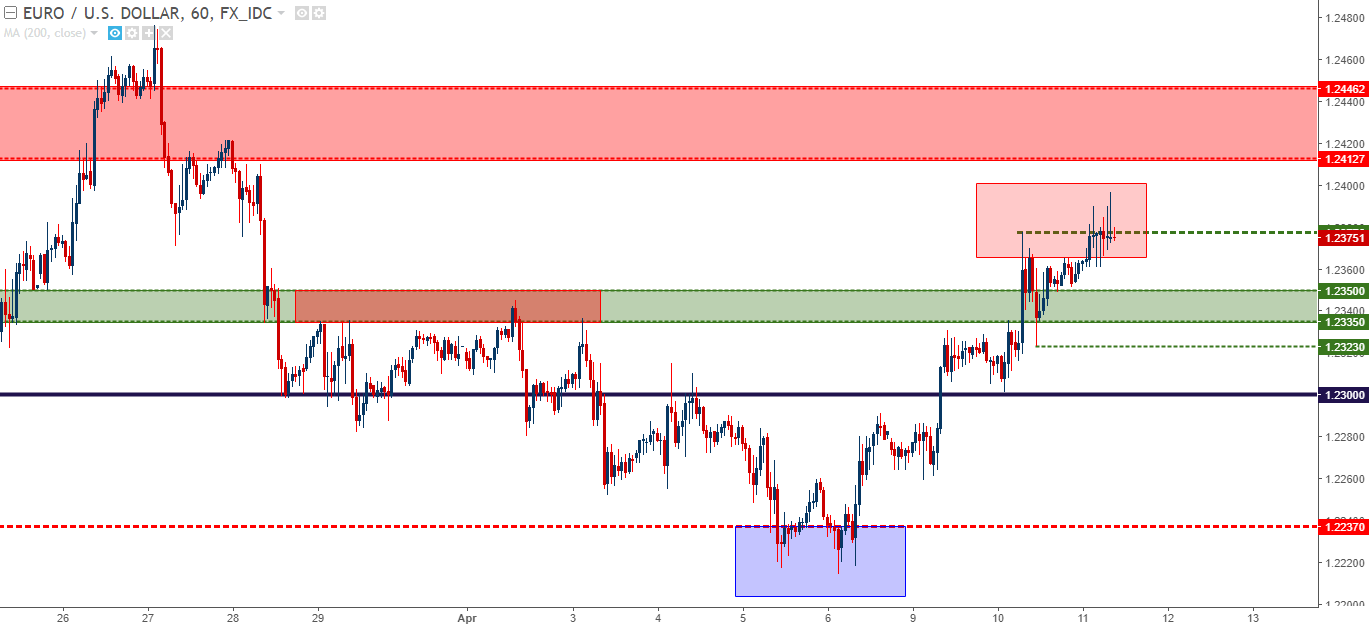
Chart prepared by James Stanley
S&P 500 Pent Up Price Action as Wedge Narrows
It looks as though the day may usher in some equity volatility, and given the pattern of responsiveness to matters out of Washington, D.C., it would be reasonable to expect some element of continuation in a theme that’s become more prominent so far in 2018.
The S&P 500 has seen price action narrow throughout out the month of April. There’s been a build of resistance around 2650, combined with a continuation of higher-low support. There’s a Fibonacci level at 2611, and if this breaks, the swing-low at 2584 is exposed. If that breaks – the next area of interest is at the 2554 April low, and below that, we have the double bottom from February at 2530. If that breaches, look out below as there isn’t much for relevant support nearby.
On the flip side, this resistance has been holding for two-and-a-half weeks now, and this has reversed multiple topside runs over that time. If we do see enough strength to break through resistance, this can lead to a sharp topside move that could run up to the 2700 level that we haven’t seen since before the Fed’s March rate hike.
S&P 500 Four-Hour Chart: Wedge Building as Price Action Narrows in April
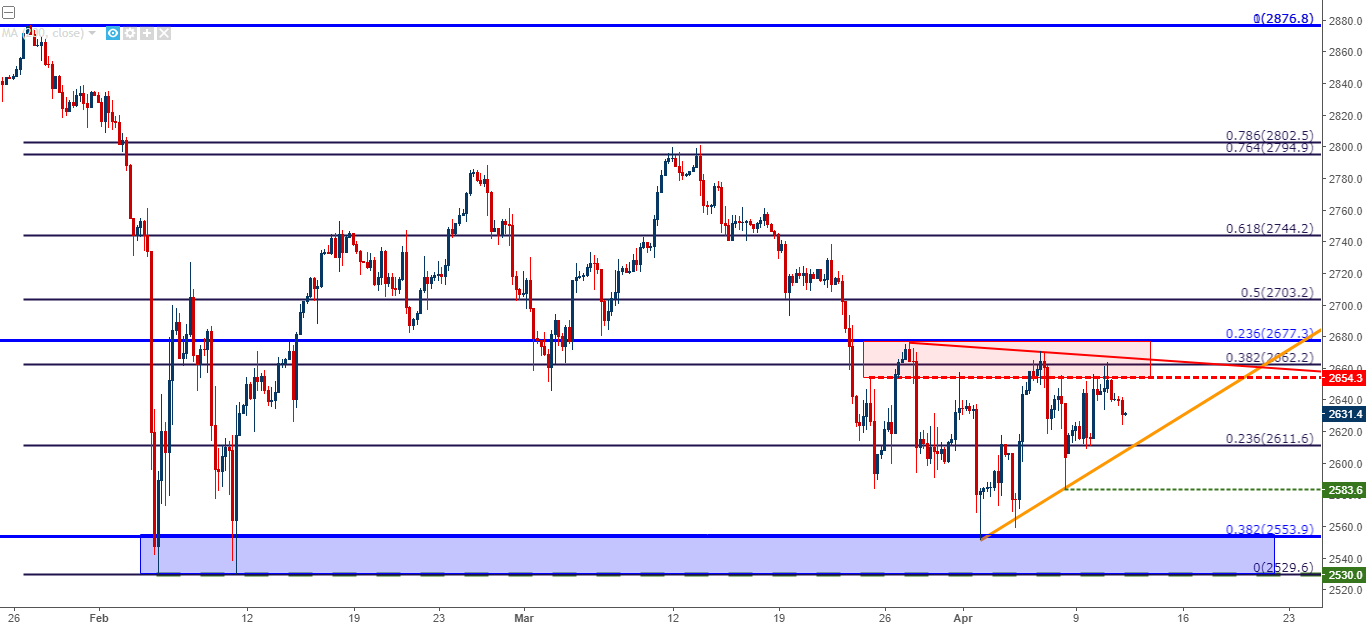
Chart prepared by James Stanley
To read more:
Are you looking for longer-term analysis on the U.S. Dollar? Our DailyFX Forecasts for Q1 have a section for each major currency, and we also offer a plethora of resources on USD-pairs such as EUR/USD, GBP/USD, USD/JPY, AUD/USD. Traders can also stay up with near-term positioning via our IG Client Sentiment Indicator.
Forex Trading Resources
DailyFX offers a plethora of tools, indicators and resources to help traders. For those looking for trading ideas, our IG Client Sentiment shows the positioning of retail traders with actual live trades and positions. Our trading guides bring our DailyFX Quarterly Forecasts and our Top Trading Opportunities; and our real-time news feed has intra-day interactions from the DailyFX team. And if you’re looking for real-time analysis, our DailyFX Webinars offer numerous sessions each week in which you can see how and why we’re looking at what we’re looking at.
If you’re looking for educational information, our New to FX guide is there to help new(er) traders while our Traits of Successful Traders research is built to help sharpen the skill set by focusing on risk and trade management.
--- Written by James Stanley, Strategist for DailyFX.com
To receive James Stanley’s analysis directly via email, please SIGN UP HERE
Contact and follow James on Twitter: @JStanleyFX


