


Talking Points:
- Tomorrow’s economic calendar brings a key piece of data to markets with the release of US inflation figures for the month of January. US Stocks, Treasury Yields and Market Volatility have all displayed sensitivity towards US inflation figures of recent, and this print will be widely-watched for clues towards what the Fed might do in the rest of 2018.
- US Dollar strength from last has dissipated and bears have pushed prices back-below the 90.00 level on DXY. This has helped to firm both EUR/USD and GBP/USD, but there is a striking difference with how that USD-weakness has priced in. This can be used for strategy moving-forward.
- Are you looking to improve your trading approach? Check out Traits of Successful Traders. And if you’re looking for an introductory primer to the Forex market, check out our New to FX Guide.
If you’re looking for longer-term analysis on US Stocks, the Euro or the U.S. Dollar, click here for our Trading Guides.
US Dollar Drops Back-Below 90.00
Yesterday, we looked at the US Dollar showing some element of strength after spending much of last week recovering from the January sell-off. The US Dollar basket ‘DXY’ had traded above the psychological level of 90.00 last Wednesday ahead of the BoE; and price action held above this support level until earlier this morning when a stream of selling engulfed the US Dollar.
US Dollar via ‘DXY’ Two-Hour Chart: Sellers Show-Up to Break Last Week’s Streak
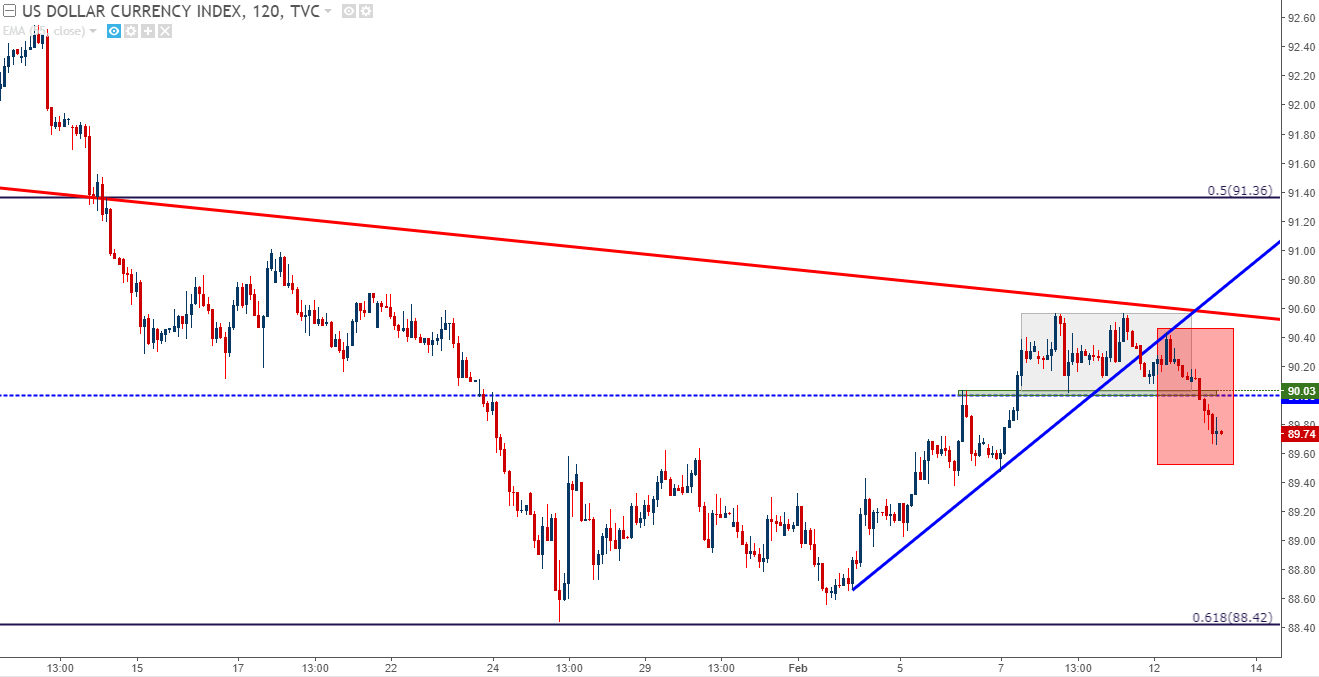
Chart prepared by James Stanley
Tomorrow’s US Inflation to Set the Stage
Dollar strength began to show a bit more prominently after the Non-Farm Payrolls report earlier in February. Within that report was the strongest wage growth in the United States since 2009, and this helped to stoke fears of stronger forces of inflation pushing the Fed into an even more-hawkish stance. This helped to strengthen US Treasury Yields, and Dollar bulls came along for the ride.
Tomorrow brings US Inflation figures for the month of January. The expectation is for an annualized 1.9% print, or 1.7% from core inflation. This is just inside of the Fed’s 2% target, but if we do see this come-out above expectations, particularly if we see inflation print at 2.1% or more, then we can quickly see that prior theme come back with force, where a stronger Dollar and higher US yields create additional pressure in equity markets.
On the US Dollar – the big question is whether the long-term support that showed-up a couple of weeks ago might hold. The low from latter-January came-in around a key Fibonacci level at the 61.8% retracement of the 2014-2017 move. The 50% retracement of the same study led to the longest bout of USD-strength that was seen last year, and since we touched down towards that Fibonacci level a few weeks ago, bears have been unable to break-below.
US Dollar Weekly Chart: Will Longer-Term Support Hold?
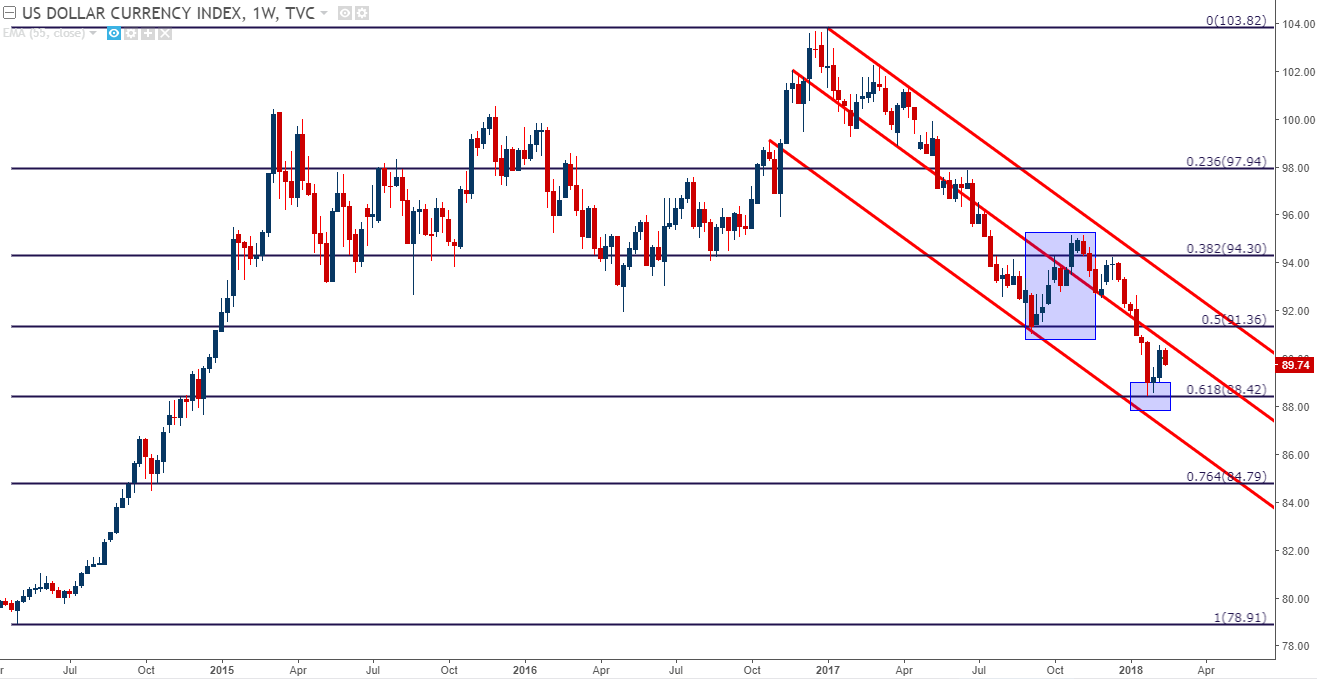
Chart prepared by James Stanley
EURUSD Bounce to Short-Term Resistance at Prior Support
With the Dollar seeing weakness return, it can be a good time for traders to evaluate which major pairs may be most beneficial to work with should this theme continue and should new lows get printed. As in, if we compare the bounce in EUR/USD versus the bounce in GBP/USD this morning, we can see that Euro bulls grabbed on to that Dollar weakness more aggressively than what was seen in Cable. And while this is far from a certainty that this will continue in the same manner moving-forward, it does give traders a qualitative difference between the two markets that could allow them to position accordingly.
EURUSD Hourly Chart: Short-Term Higher Highs and Lows as Prices Find Resistance at Old Support
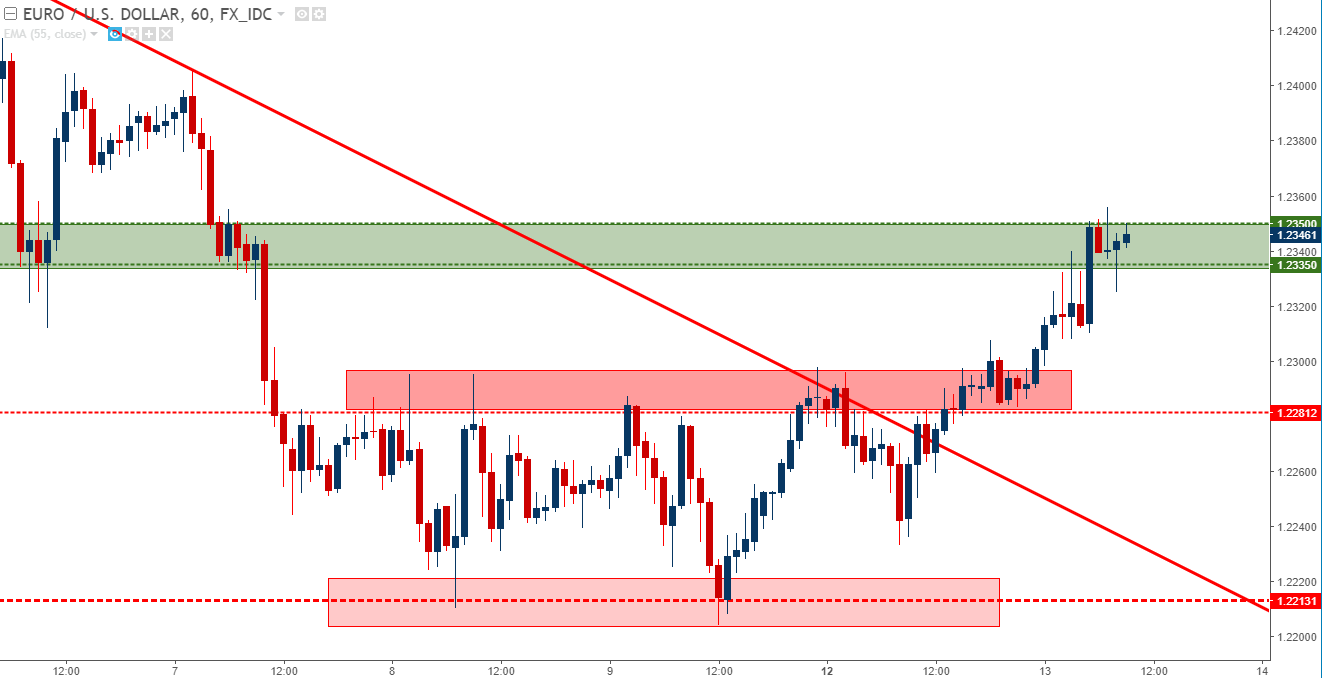
Chart prepared by James Stanley
EUR/USD was crafting a retracement after last week’s pull lower, and the USD-weakness produced in the early portion of this week has helped the pair bounce back-up to a prior support level. We’re currently seeing a bit of resistance play off of this prior support area, but should prices re-engage above 1.2350, the door is re-opened for bullish continuation.
EURUSD Four-Hour Chart: Near-Term Resistance Off of Prior Zone of Support
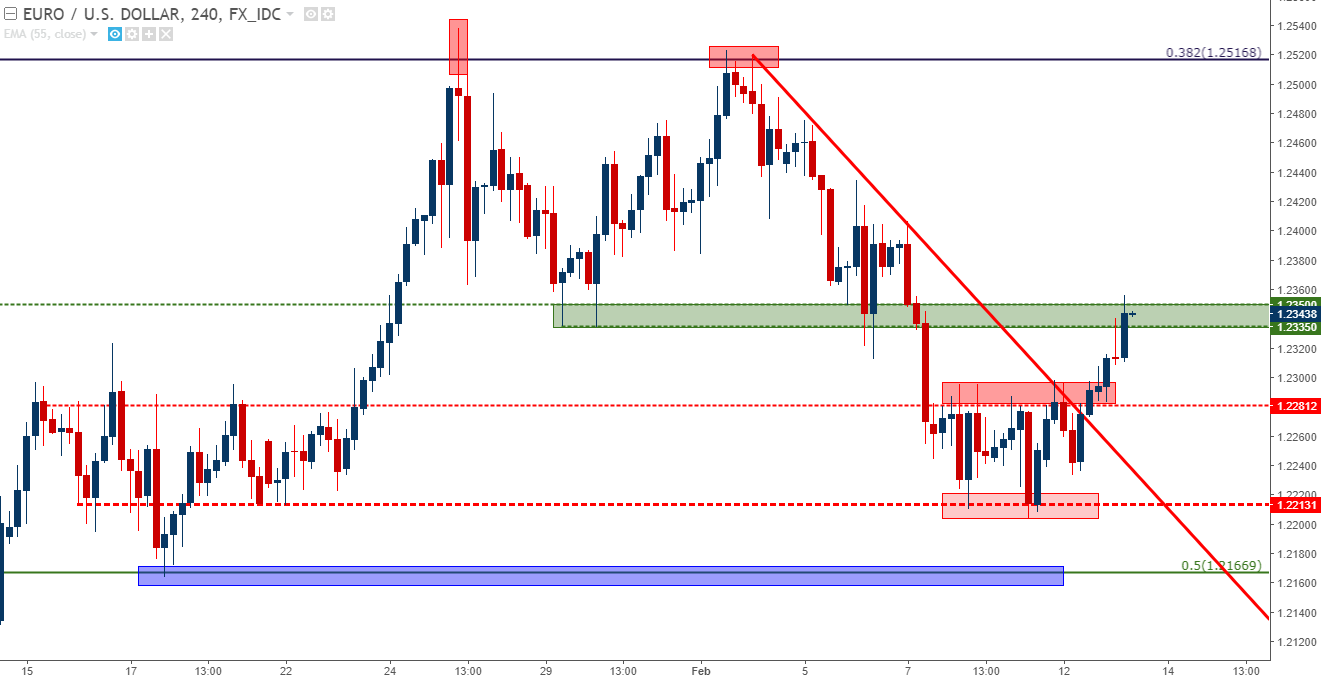
Chart prepared by James Stanley
GBP/USD Poses a Meager Bounce
Cable, on the other hand, is getting a more meager bounce than what we’re seeing in EUR/USD, and prices are remaining subdued below the 1.4000 psychological level. Making this backdrop even more daunting is the fact that UK inflation came-out above expectations earlier this morning; but GBPUSD bulls appear rather uninterested at this point. This could keep GBP/USD more attractive for USD-strength scenarios as a weak GBP has helped to offset some of this morning’s selling in the Dollar. On a longer-term basis, we’ve been following an area underneath current price action for potential longer-term support, and this area resides from 1.3589-1.3658.
On the below chart, we can see Cable continuing to grasp onto confluent support, but notice the more meager bounce that we’re seeing off of the Friday and Monday lows compared to what was seen in EUR/USD above.
GBP/USD Hourly: Trying to Hold Confluent Support, More Meager Bounce from Friday, Monday Lows
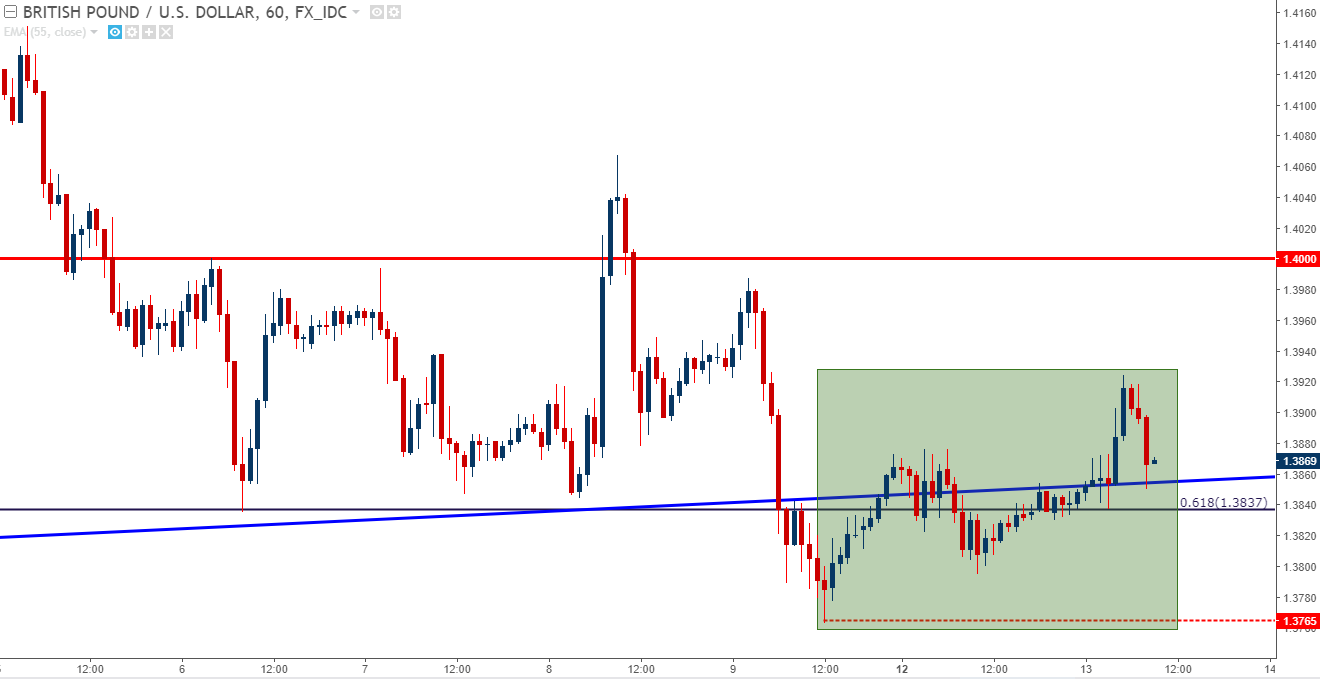
Chart prepared by James Stanley
USD/CHF for USD-weakness scenarios
Another pair that may be interesting to Dollar bears is USD/CHF. While that trend in EUR/USD was rather loud throughout much of last year, more recently we’ve seen what could be argued is a cleaner move in USD/CHF. We wrote about the pair yesterday, and in the overnight session prices began breaking down, approaching a prior point of support that showed-up around the two-year low at 92.57. For Dollar bears looking at a continuation of USD-weakness beyond those three-year lows, the short-side of USD/CHF could remain a favored area.
USD/CHF Two-Hour Chart: Bearish Break of Bear Flag After Two-Year Lows Hold (~.9250)
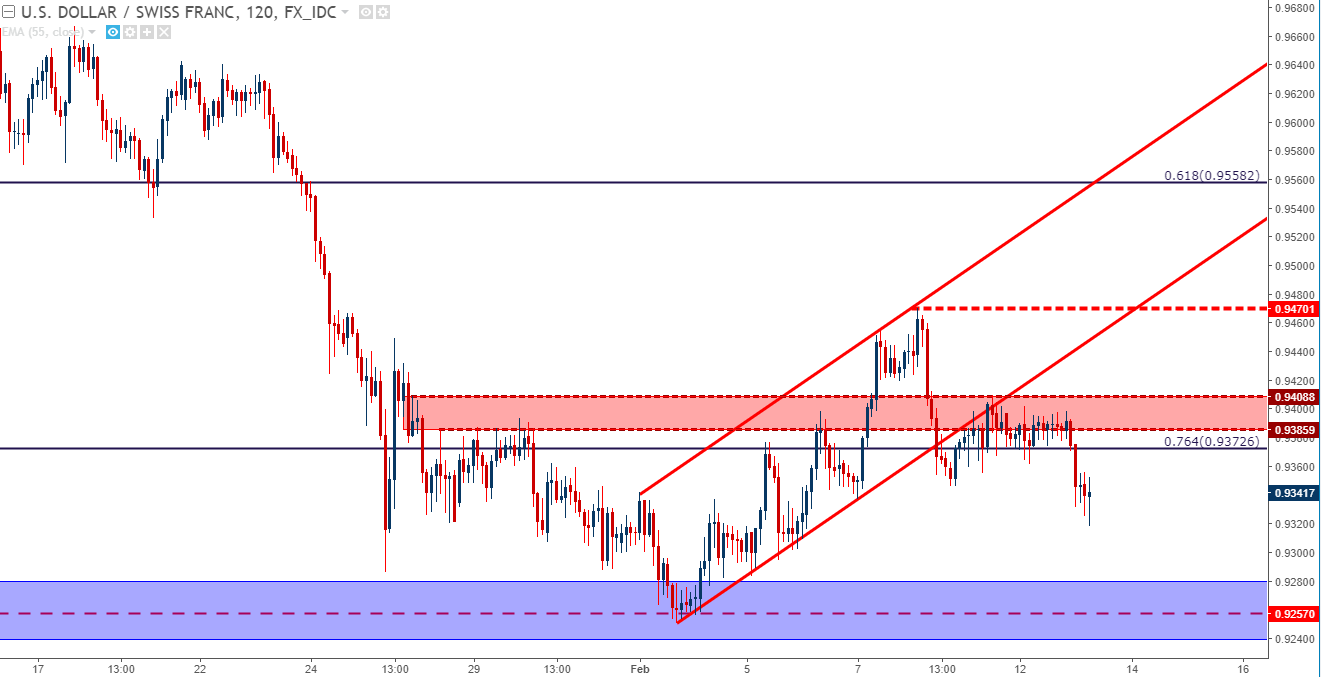
Chart prepared by James Stanley
AUD/USD for USD-Strength Scenarios
When the Dollar did begin to establish support in late-January and move-higher in early February, AUD/USD posed a hard reversal as prices screamed-lower. There was hardly a chance to jump on as price action sold-off, but after a bounce on Friday and Monday, we may have a bit of lower-high resistance to work with. At the very least, this comes close to a confluent area of potential resistance that exists from .7930-.7950, and this can keep short-side strategies alive as traders look to pick their spots around the US Dollar.
AUDUSD Four-Hour Chart: Lower-Lows, Highs After False Breakout at 2.5 Year High
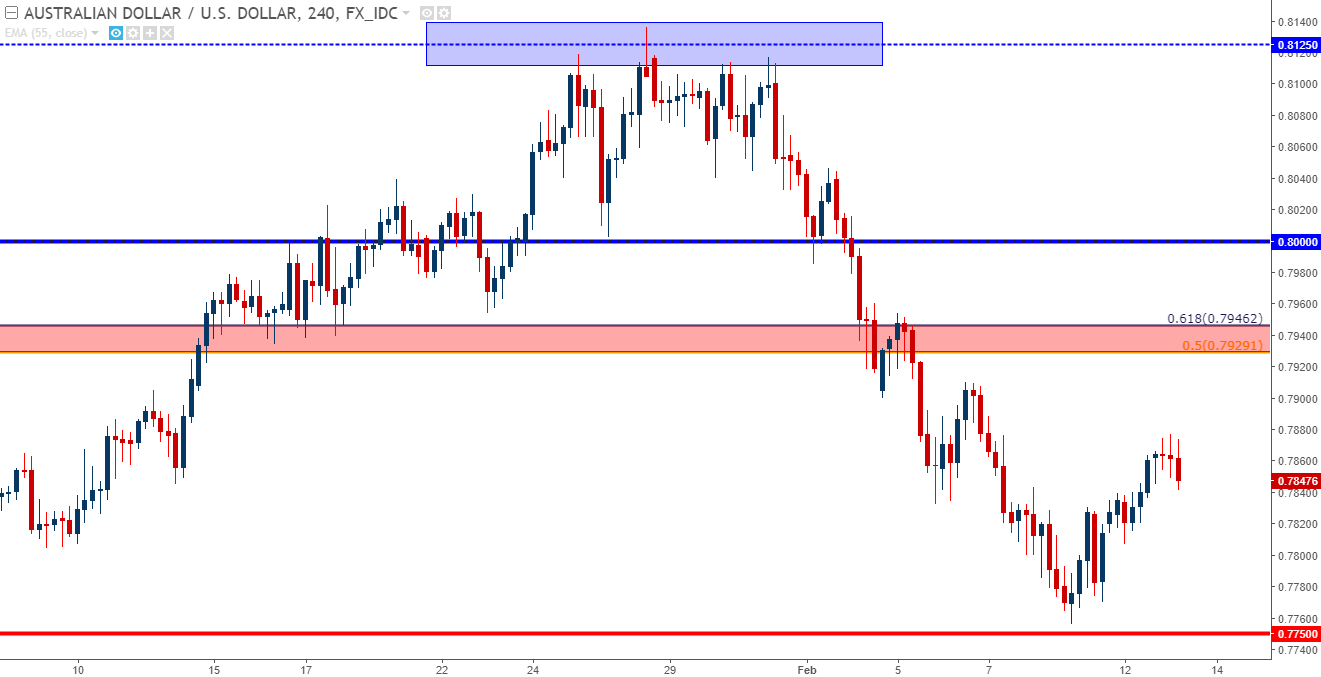
Chart prepared by James Stanley
To read more:
Are you looking for longer-term analysis on the Euro, the British Pound or the U.S. Dollar? Our DailyFX Forecasts for Q1 have a section for each major currency, and we also offer a plethora of resources on our EUR/USD, GBP/USD, USD/JPY, AUD/USD and U.S. Dollar pages. Traders can also stay up with near-term positioning via our IG Client Sentiment Indicator.
--- Written by James Stanley, Strategist for DailyFX.com
To receive James Stanley’s analysis directly via email, please SIGN UP HERE
Contact and follow James on Twitter: @JStanleyFX


