


Talking Points:
- Friday’s close was marked by the biggest sell-off in the equity space in months after a strong NFP report earlier in the morning.
- At this stage, the move in equities is just a pullback. The bigger question is whether it develops into something more.
- Are you looking to improve your trading approach? Check out Traits of Successful Traders. And if you’re looking for an introductory primer to the Forex market, check out our New to FX Guide.
To receive James Stanley’s Analysis directly via email, please sign up here
Stocks Pull Back as 10-Year Treasury Yields Set Four-Year High
Friday’s Non-Farm Payrolls numbers came in fairly strong, with a print of +200k versus an expectation of +180k along with a strong rise in wage growth as Average Hourly Earnings were up by .3% for an annualized 2.9% clip. This was the best performance in Average Hourly Earnings since mid-2009, and given how wage growth is such a strong precursor to inflation, this gives additional evidence that we might be seeing a more hawkish Fed as the year continues to develop.
The near-immediate response was another bump-higher in Treasury yields as bonds sold-off, and this helped to extend the January move that saw yields on the 10-year jump all the way up to 2.75% from 2.42%. A really fast and furious Friday saw this number drive all the way up to 2.85% to give us our highest marker since January of 2014; marking a fresh four-year high for 10-year treasury yields.
Ten-Year Treasury Yields Since 1998, Highest Since January, 2014
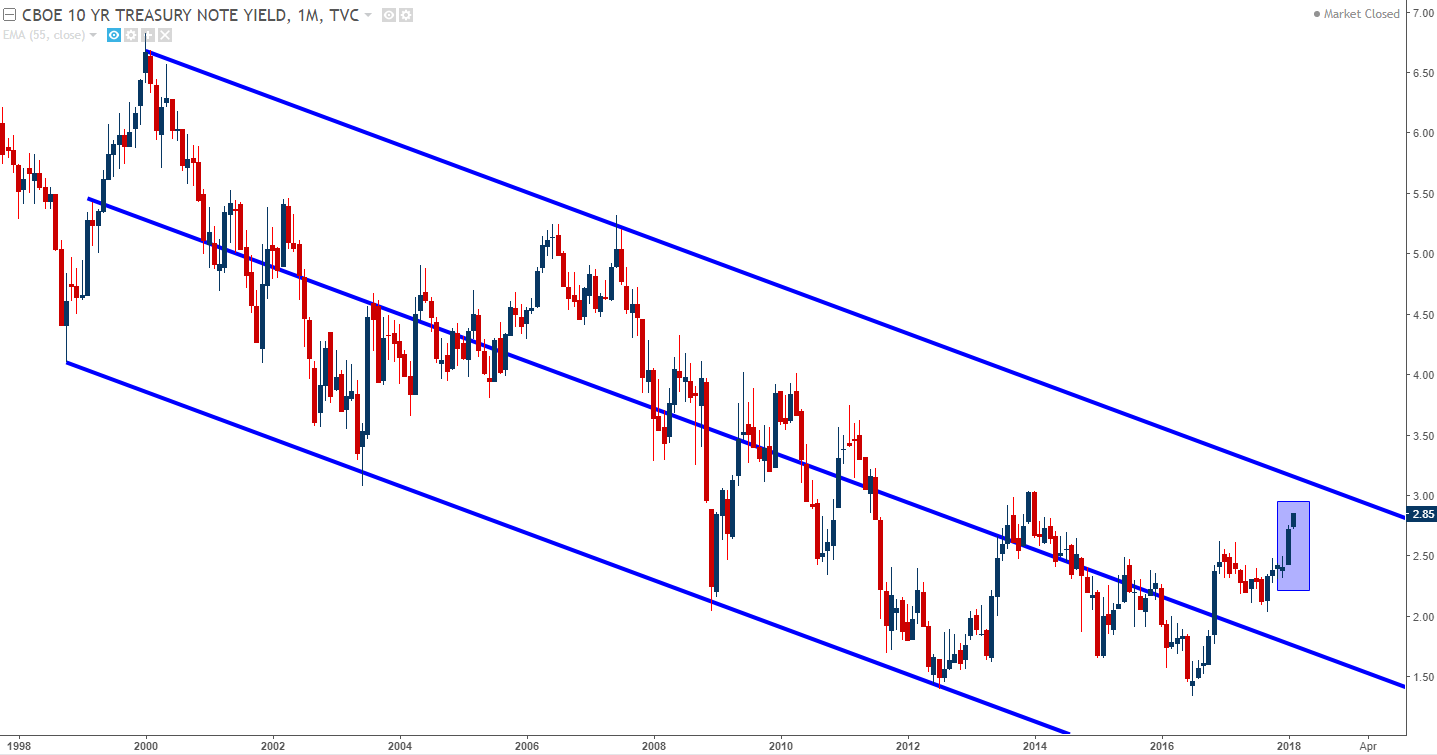
Chart prepared by James Stanley
This move-higher in Treasury Yields hit U.S. Equities as more evidence has shown that the Fed may be looking at even tighter operating conditions this year than was initially expected. With a European Central Bank that is likely staring down their own stimulus exit, the global liquidity picture is changing significantly. The Fed is now in the early stages of Quantitative Tightening, letting bonds mature and roll-off their balance sheet after having accumulated more than $4 Trillion in the aftermath of the Financial Collapse. Growth in Europe remains stable, so it’s reasonable to expect that the ECB will have to move away from stimulus before too long; and as investors plot the course ahead, very high valuations across the equity space can be a bit more difficult to justify in a tighter operating environment.
At the very least, this recent move has prodded investors to take a step back and equities have taken a bit of a hit in the process. On the chart below, we’re looking at the S&P 500 since September of last year, including this morning’s price action. While the Friday spill looks aggressive with a big red bar, the passive exuberance that had shown previously was likely in need of a washout. The bigger question is whether this spill in equities develops into something larger, perhaps to the point where it may end of causing the Fed to think twice about hiking rates in March.
S&P 500 Since September: Near-Term Bearish, Longer-Term Bullish Theme
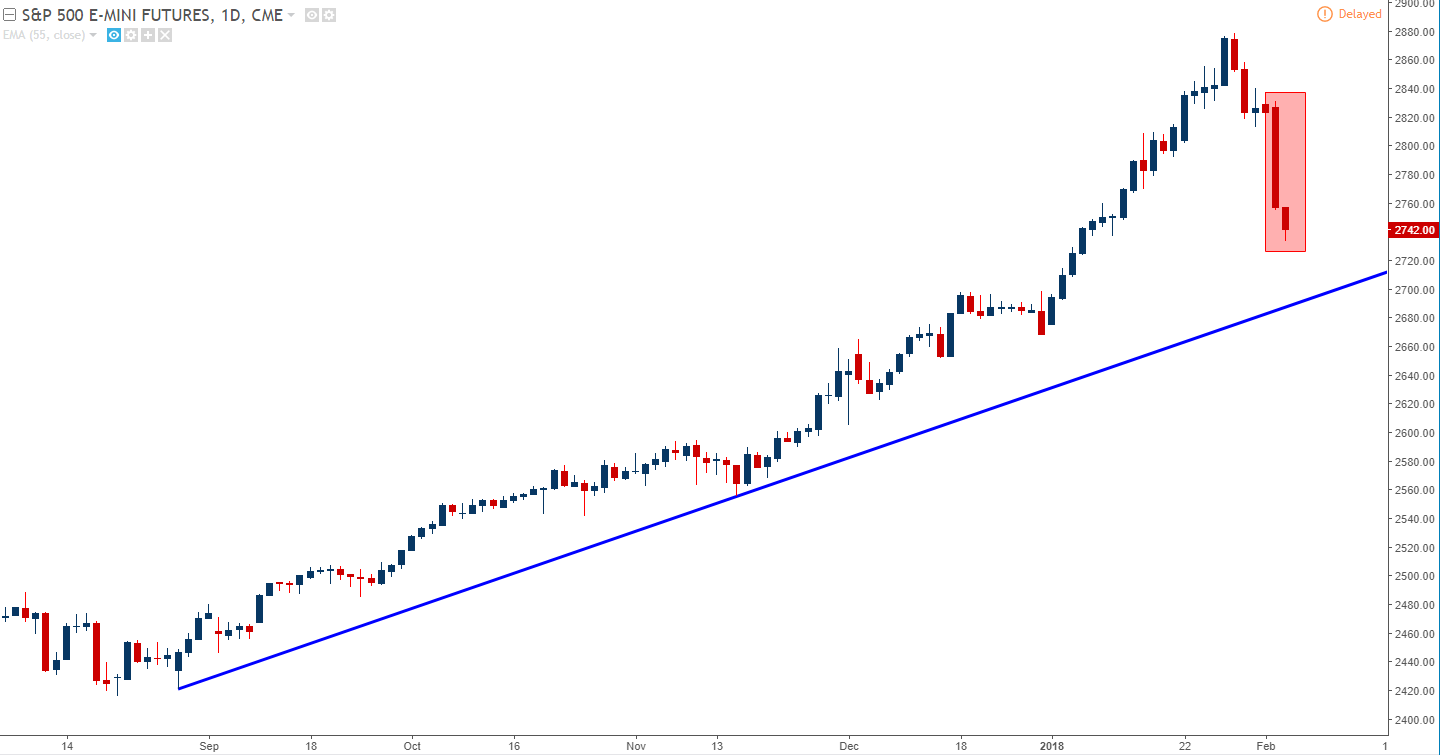
Chart prepared by James Stanley
US Earnings This Week: CMG, DIS, TSLA, ATVI, NVDA
U.S. Equities will see a number of big names report earnings this week, and this will likely have some element of pull in stock markets. While many tech bellwethers reported last week, with the likes of Amazon (AMZN), Apple (APPL), and Alphabet (GOOG) having all already released their most recent numbers, this week brings Chipotle (CMG) and Disney (DIS) reporting tomorrow after the close, Tesla (TSLA) reports on Wednesday and Activision (ATVI) and Nvidia (NVDA) come in after the bell on Thursday. Nvidia in particular will be interesting given the company’s exposure to cryptocurrency, with graphics cards for crypto mining having become a much larger part of their business in recent years.
On a price action front – Amazon will be interesting this week after having reported blowout numbers on Thursday. Prices gapped-higher on Friday morning but were unable to recover as larger macro themes took over: Prices came just $2 from hitting the psychological $1500 level for the first time ever, and if we do see a larger recovery in the equity space this week, that becomes an interesting target to look for.
Amazon (AMZN) Hourly: 2018 Bullish Trend Remains After Friday's Fade

Chart prepared by James Stanley
This Week's Economic Docket
While last week’s data had a very heavy emphasis on U.S. issues, this week spreads out a bit. We get major rate decisions out of Australia, New Zealand and a Super Thursday event out of the Bank of England that will include updated inflation forecasts via the Quarterly Inflation Report. Notably – this week is light on Euro and U.S. issues, so this could present a fantastic opportunity for prevailing trends to avail themselves. Below, we’re looking at the high-impact releases for this week:
DailyFX Economic Calendar: High-Impact Releases For Week of Feb. 5, 2018

Chart prepared by James Stanley
Will the U.S. Dollar Break its Recent Impasse?
The big question across currency markets for this week is whether or not the Dollar can start to show some form of trend. Coming into last week after another spill-lower, price action carried a bearish tone in the early portion of the week followed by a bullish drive towards the latter-half of the week, capped by that NFP run on Friday. On the hourly chart below, we’re looking at this recent range in the U.S. Dollar via ‘DXY’.
U.S. Dollar Two-Hour Chart: Back-and-Forth Since Fresh Three-Year Lows

Chart prepared by James Stanley
EUR/USD For USD-Weakness Themes
Going along with the recent drubbing in the U.S. Dollar has been the bullish surge in the Euro. Prices in EUR/USD catapulted all the way above 1.2500 in January after the ECB rate decision to craft a fresh three-year high in the pair. But – since then, bulls have been unable to make much ground as back-and-forth action in the U.S. Dollar brought a bit of a pullback to that bullish theme in EUR/USD.
EUR/USD Hourly: Fibonacci Resistance Holds, Short-Term Supports Applied
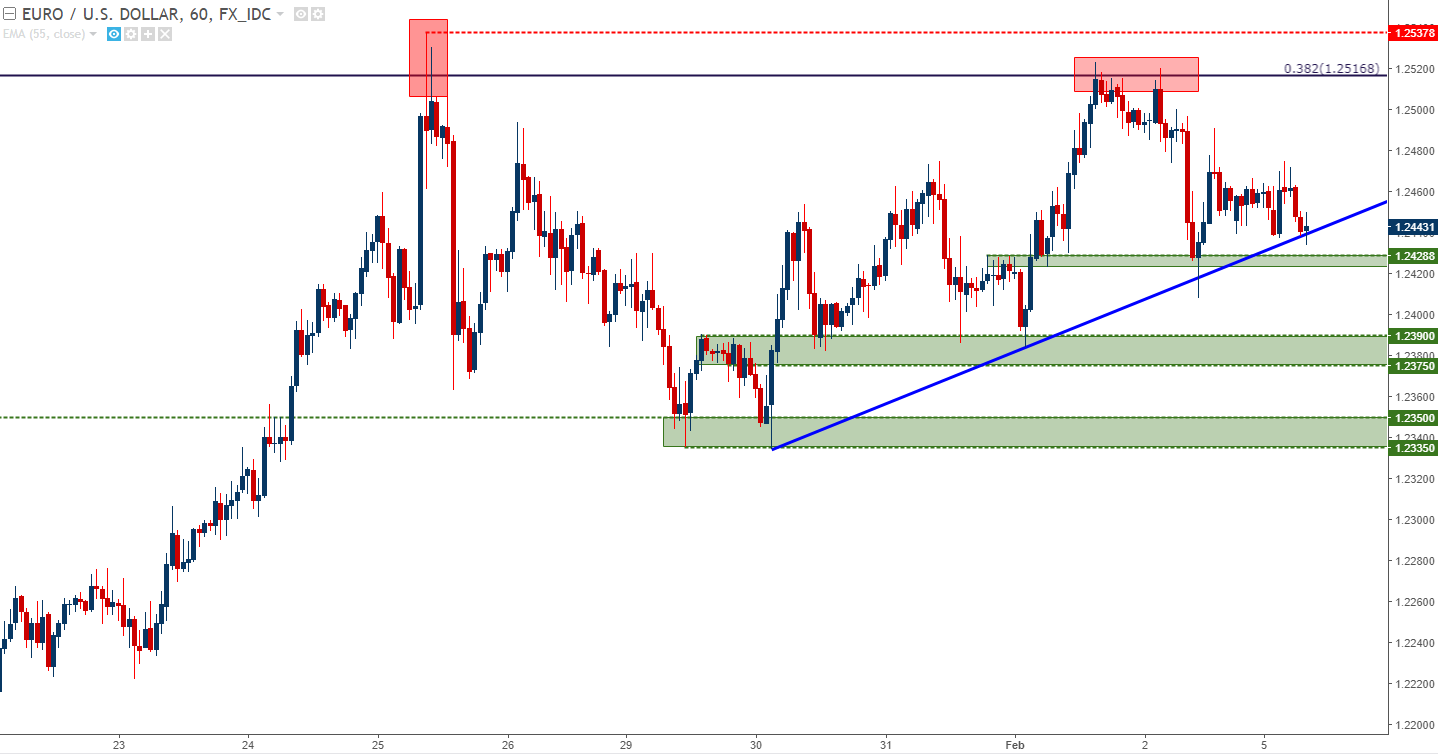
Chart prepared by James Stanley
For USD-Strength Strategies: USD/JPY Beginning to Perk Up
On the long side of the Dollar, there hasn’t been much that’s been attractive over the past few months given the back-breaking weakness that’s shown up. But – one currency that has held its own, showing almost as much weakness over the past nine months has been the Japanese Yen. This can be evidenced in the longer-term range that’s built in the pair since last April. With prices beginning to bounce from this longer-term support zone, the door can be opened to topside plays under the premise that the range will fill-in; and for a bullish USD-thesis, this would likely be one of the more attractive areas at the moment.
USD/JPY Daily: Longer-Term Support, Bigger Picture Range-Fill Potential
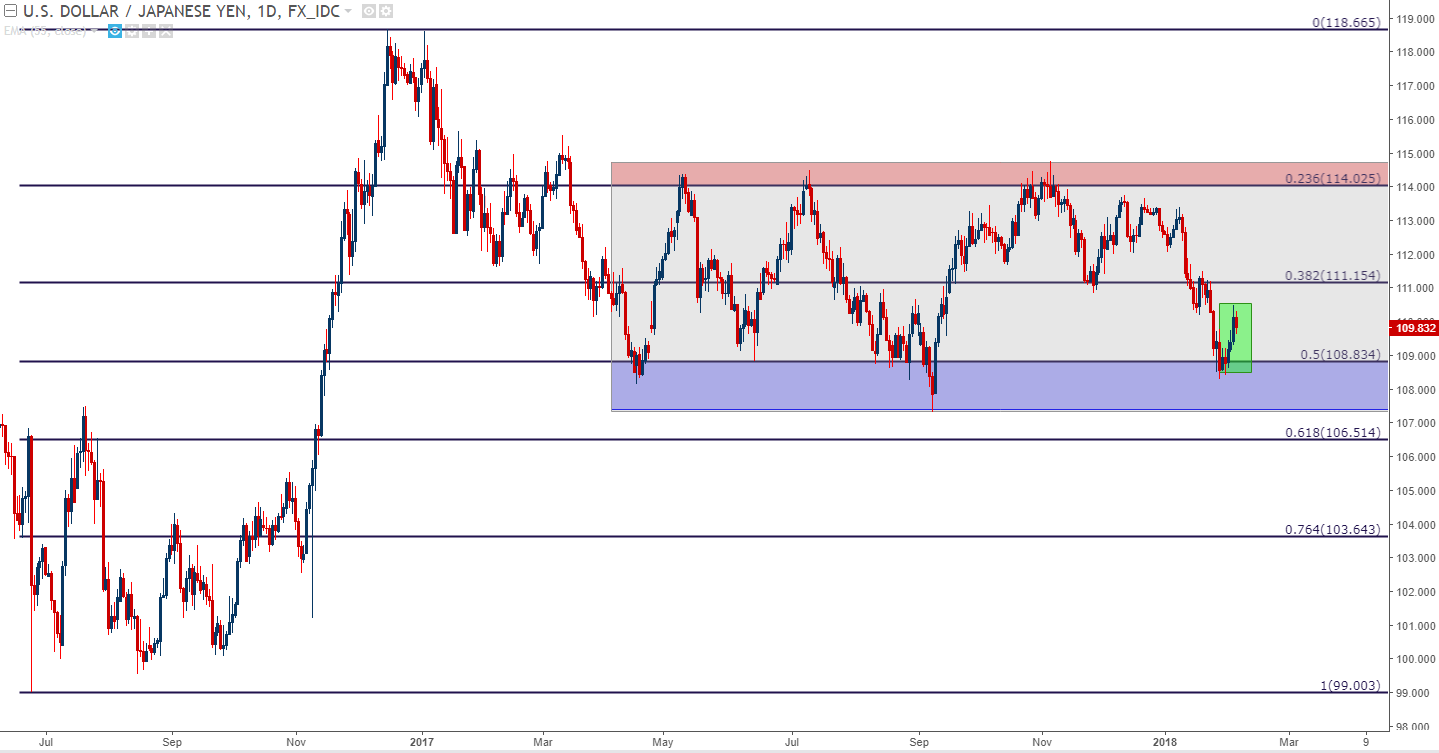
Chart prepared by James Stanley
To read more:
Are you looking for longer-term analysis on Euro, or the U.S. Dollar? Our DailyFX Forecasts for Q1 have a section for each major currency, and we also offer a plethora of resources on our EUR/USD, GBP/USD, USD/JPY, AUD/USD and U.S. Dollar pages. Traders can also stay up with near-term positioning via our IG Client Sentiment Indicator.
--- Written by James Stanley, Strategist for DailyFX.com
To receive James Stanley’s analysis directly via email, please SIGN UP HERE
Contact and follow James on Twitter: @JStanleyFX


