


Talking Points:
- The U.S. Dollar is perking up ahead of tomorrow’s release of Non-Farm Payrolls: The expectation is for +195k jobs to have been added to American Non-Farm Payrolls in the month of November.
- Next week brings the Federal Reserve with what’s widely-expected to be the bank’s third hike this year.
- If you’re looking for big picture trade ideas or education, please check out our Trading Guides. And if you’re looking for shorter-term ideas, our IG Client Sentiment indicator can help.
To receive James Stanley’s Analysis directly via email, please sign up here
Tomorrow brings U.S. Non-Farm Payrolls, and then next Wednesday brings a Federal Reserve rate decision with a widely-expected rate hike. Over the next week, the U.S. Dollar will likely remain in-focus.
This comes after a year that’s been tough for Dollar bulls: After coming into 2017 riding the wave of the ‘Reflation Trade’, the Greenback turned around in the first quarter and never really looked back. By September 8th, the U.S. Dollar had lost -12.33% from the high set on January 3rd, and there were few expectations for any cessation of that weakness. But as we moved through the remainder of September and early-October, we price action start to show some semblance of strength. When the ECB extended their QE program into 2018, the Dollar finally caught some element of a bid to set a fresh three-month-high; but that was short-lived as Dollar bears just ended up punching prices back down into the prior range just a few weeks later.
U.S. Dollar via ‘DXY’ Daily: 2017 Down-Trend Continues as Prices Unable to Hold Above Resistance

Chart prepared by James Stanley
Since then, we’ve been waiting for the Dollar to show some element of direction. This has started to show over the past couple of days as price action has started to tip-toe higher on the chart. But we’re fast approaching an area that has been a key decision point on the U.S. Dollar this year; and we’re referring to a zone that exists between the prices of 94.08 and 94.30. If the U.S. Dollar is able to re-engage above this level, the door can open for bullish exposure as we move towards year-end.
USD Four-Hour: Two-Week Highs with Price Action Fast Approaching Key Zone 94.08-94.30
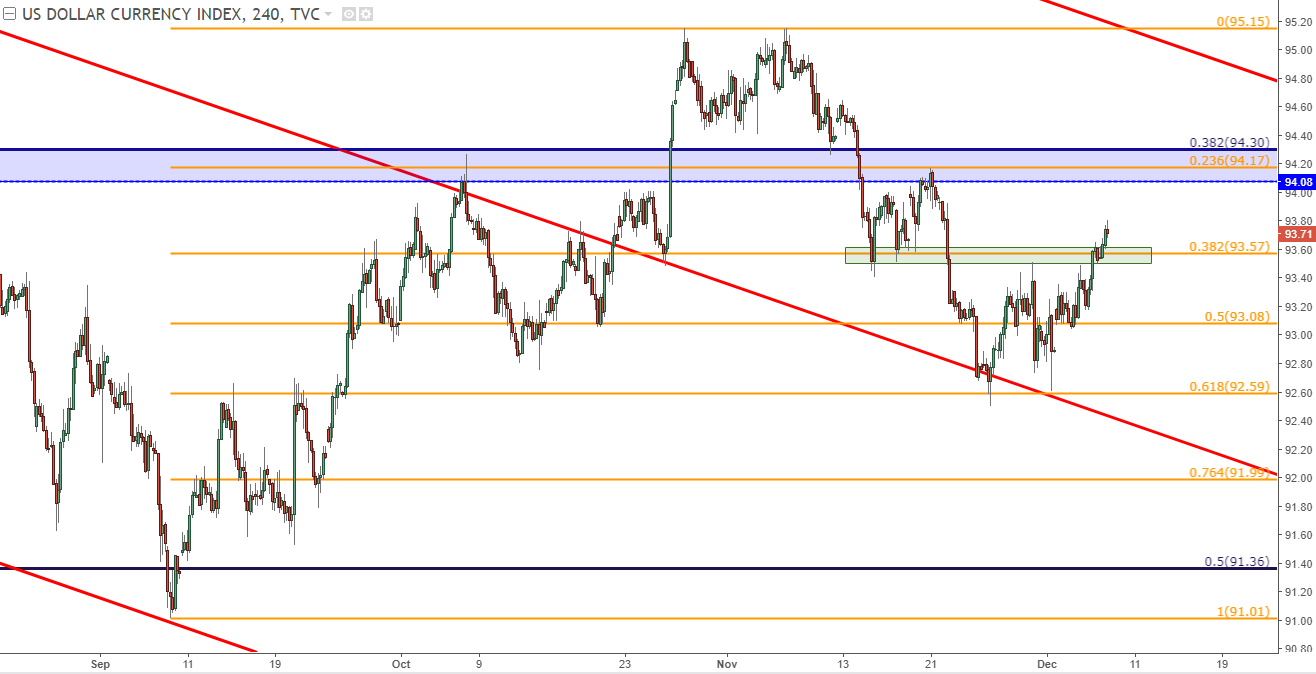
Chart prepared by James Stanley
EUR/USD – Sliding Scales of Support
As USD-strength has started to show a bit more of recent, the retracement in EUR/USD has deepened. We looked at this in-depth yesterday, and the setup is very similar with a slightly deeper retracement.
The big question is whether we see higher-low support above the prior swing-low of 1.1712. If we do – the door remains open for top-side positions. But if we don’t questions about around the possibility of bullish continuation in the pair as we head towards year-end. For establishing bearish exposure or looking for a reversal of the recent bullish move, traders will likely want to await a down-side break below 1.1685.
EUR/USD Four-Hour: Faltering Support at Trend-Line Projection, Key Zone 1.1685-1.1736

Chart prepared by James Stanley
We wrote about Cable’s technical setup yesterday, and we pointed out a key level around 1.3320. This is the 38.2% retracement of the August-September bullish move, and this price twice-helped to set resistance in the pair when we were in the midst of that messy price action through much of October/November. As we wrote yesterday, a support check at this level opened the door for top-side setups, targeting the key Fibonacci level around 1.3477.
GBP/USD Four-Hour: Support Bounce at Prior Resistance, 38.2% Fib Retracement at 1.3320
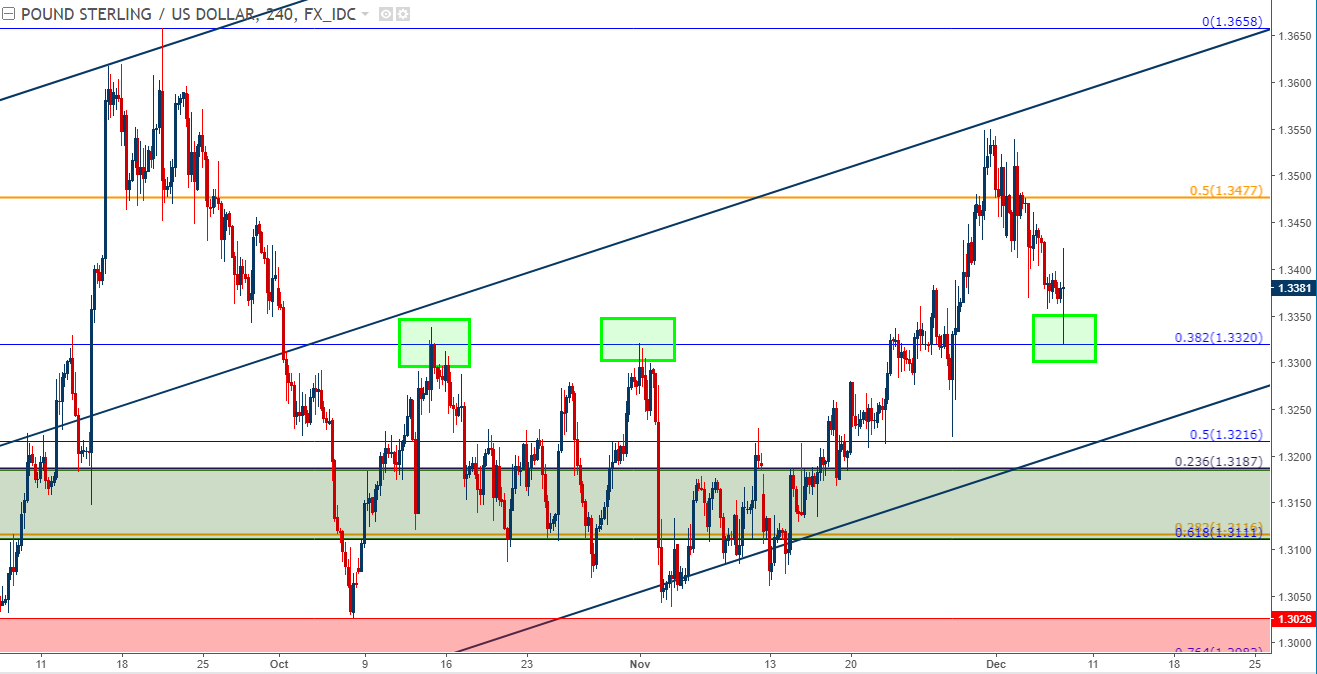
Chart prepared by James Stanley
We looked at USD/CAD yesterday ahead of the Bank of Canada rate decision, and we pointed out that prices were sitting in a key zone of support as we approached that meeting. The BoC made no moves yesterday, as was widely expected, and the immediate response of CAD-weakness has, at least so far, been able to continue into this morning. At this point, we’re seeing the range in USD/CAD that we had identified yesterday starting to fill in on the long side, with prices fast approaching resistance around 1.2900.
USD/CAD Four-Hour: Range-Fill post-BoC, Resistance ~1.2900

Chart prepared by James Stanley
The Aussie has been a preferred currency for USD-strength plays going back to October. Since then, Australian Dollar weakness has taken over as the pair has plummeted down to fresh five month lows; and this has happened even within this backdrop of relative U.S. Dollar weakness.
On Monday of this week, we looked at a very interesting setup in AUD/USD, as prices were testing resistance of old support (which was also a Fibonacci level) ahead of a couple of key pieces of Aussie data, along with a rate decision out of the RBA. And while Aussie was initially strong on the first part of that data outlay leading into the rate decision, a miss on Australian GDP Tuesday evening/Wednesday morning helped to bring the bears back and the pair is now moving down to fresh lows.
At this point we’re nearing a key psychological level at .7500. We’ve seen quite a bit of support build above this level, and this could be perceived as buyers defending price action ahead of what could be key support. This also makes continuation strategies rather difficult at current levels; but if we do get a down-side break below .7500, there could be the possibility of short-side breakouts. Outside of that, traders will likely want to wait for some element of resistance to show before looking to trigger fresh shorts, similar to what we looked at on Monday.
AUD/USD Daily: Bearish Breakdown Fast Approaching .7500 Psychological Level
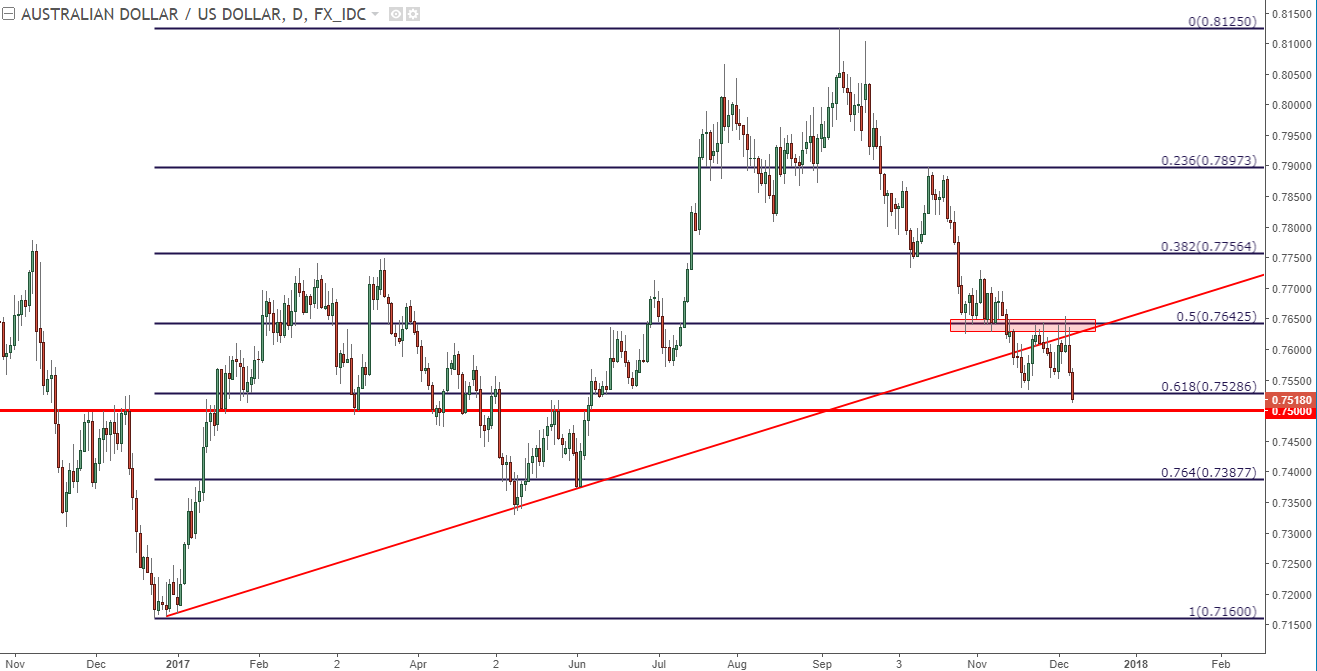
Chart prepared by James Stanley
--- Written by James Stanley, Strategist for DailyFX.com
To receive James Stanley’s analysis directly via email, please SIGN UP HERE
Contact and follow James on Twitter: @JStanleyFX


