


Talking Points:
- The Bank of Canada hosts a rate decision at 10 AM ET today, and there are minimal expectations for any actual moves at today’s meeting. More interesting will be the bank’s tone towards rate hikes in the early portion of next year.
- The U.S. Dollar remains in a rather muted space, and we looked at setups around this theme in yesterday’s webinar entitled, Dollar Range Poised to Give Way with NFP, FOMC in Sight.
- Looking for trade ideas? Check out our trading guides. And if you’re looking for something more interactive in nature, check out our DailyFX Webinars.
To receive James Stanley’s Analysis directly via email, please sign up here
The highlight of today’s economic docket comes in rather early, as the Bank of Canada rate decision is on the calendar for 10 AM ET. My colleague Christopher Vecchio discussed this rate decision earlier this morning, and expectations are very low for any moves at today’s meeting, currently showing sub-20%. Those odds begin to tick-higher as we move into 2018, however, and a more hawkish BoC statement could re-trigger the run of strength that has been seen in the Canadian Dollar for much of this year.
When the BoC started warning of rate hikes in May, CAD strength began to show after what had been a fairly weak prior 12 months. As the BoC ushered in that first hike in over nine years, USD/CAD broke below a bullish channel that had held the pair for much of the previous year. This led to a run of four months, from May to September that saw USD/CAD fall from above 1.3800 down to just above 1.2000. That low in September was set after the BoC’s second rate hike.
USD/CAD Daily: Major Trend Shift Driven by BoC’s Hawkish Twist
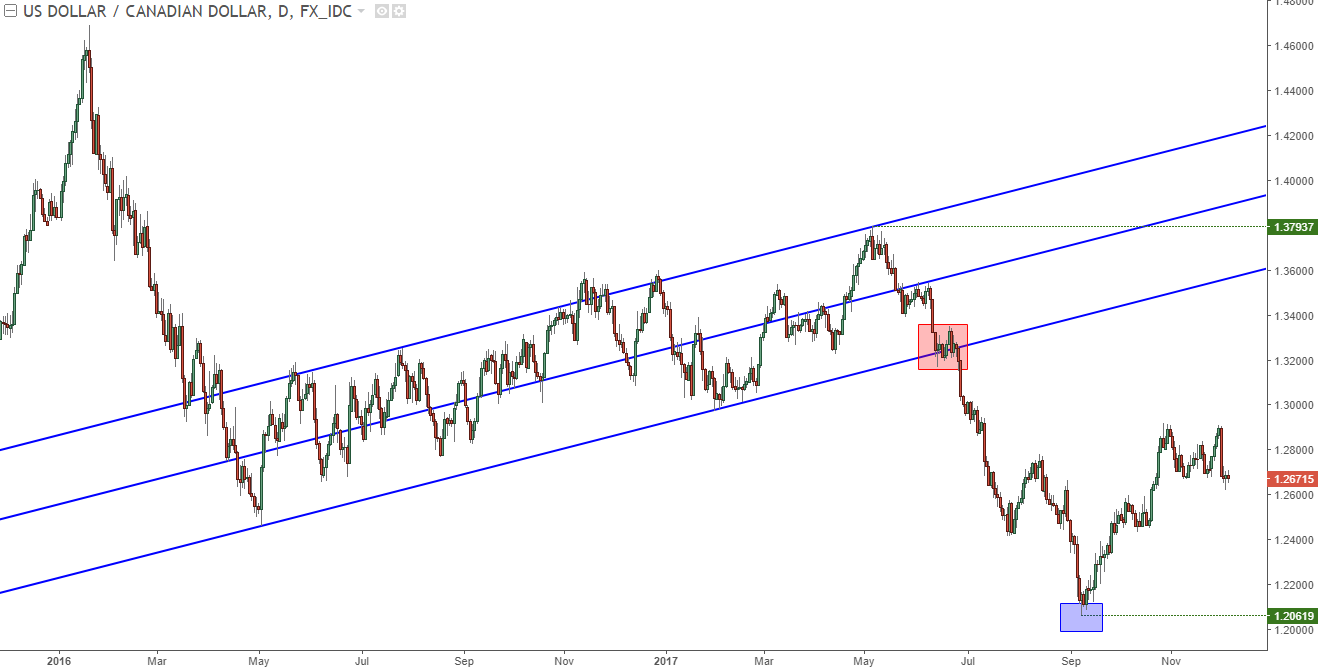
Chart prepared by James Stanley
Since that second rate hike in September, USD/CAD has continued to digest previous losses while expectations have been getting a bit more passive around the BoC, leading us into today with the minimal expectations for any near-term hikes. But – as USD weakness has started to show with a bit more prominence or, perhaps more accurately, a lack of strength in the U.S. Dollar; USD/CAD has built-in to a range, as shown below in the gray box. Support for this range has shown around 1.2600, which syncs up with a set of prior swing highs from September/October.
If we do see a sustained downside break below this zone as initiated by today’s BoC announcement, the door can be opened for short-side continuation in the pair.
USD/CAD Four-Hour: Range-Bound Past Month+, Support Test Ahead of BoC
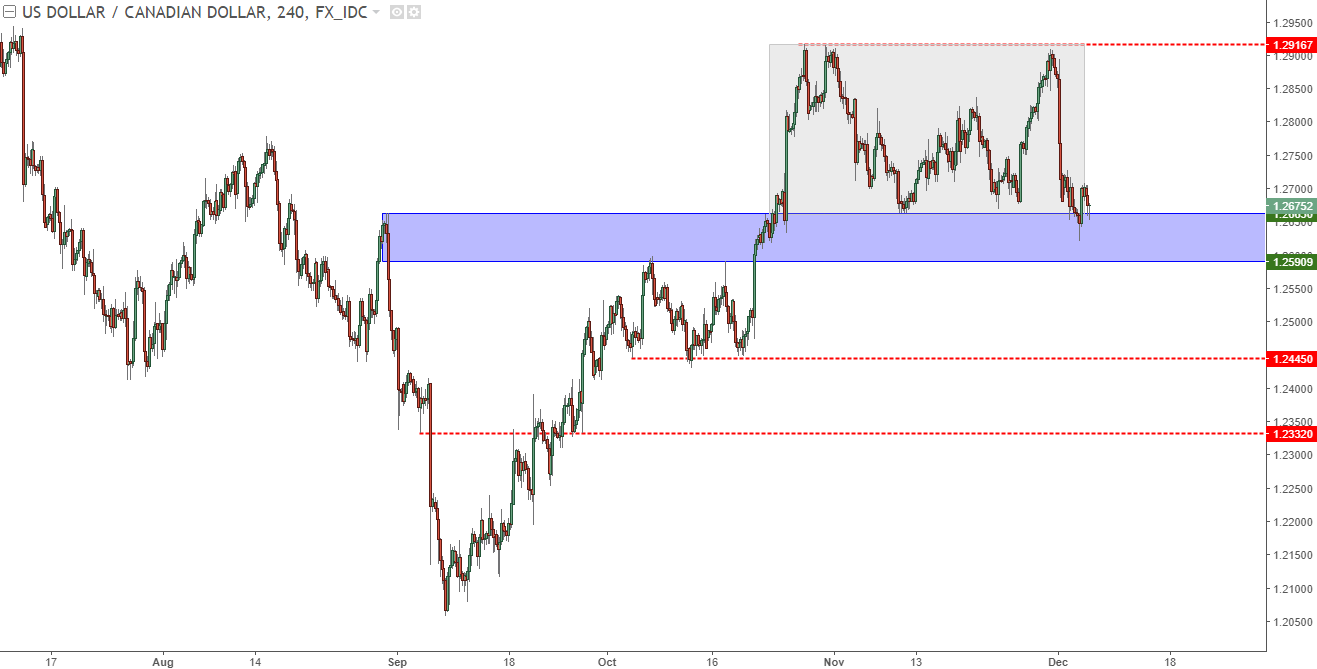
Chart prepared by James Stanley
USD Testing Short-Term Resistance Ahead of NFP
The U.S. Dollar has been rather quiet of recent, spending the past couple of weeks bouncing between 92.50 and 93.50. This leaves us in a rather muted spot on longer-term charts, as price action continues to find resistance around prior support while also building in near-term higher-lows. This can give us a type of ascending wedge formation, which could allow traders to move towards this congestion with a semi-bullish bias.

Chart prepared by James Stanley
EUR/USD Retracement Continues – Support at Trend-Line Projection
We’ve been following an area of prior swing-highs in EUR/USD in the effort of identifying higher-low support in the pair. That support held last week, even offering a morning star formation on the Daily chart. But bulls were unable to continue the move, and prices have continued to pull back towards the ‘big’ zone of support that runs from 1.1685-1.1736.
We’ve also seen support starting to show in another area, and this is taken from a trend-line projection that can be found by connecting the September 20 high to the November 15th high, which was the shooting star formation that showed up on the daily EUR/USD chart. We popped back above that trend-line two weeks ago and over the past week, a sliding scale of support has shown on the other side of the projection of that trend-line.
EUR/USD Daily: Sliding Scale of Support on Projection of Prior Trend-Line
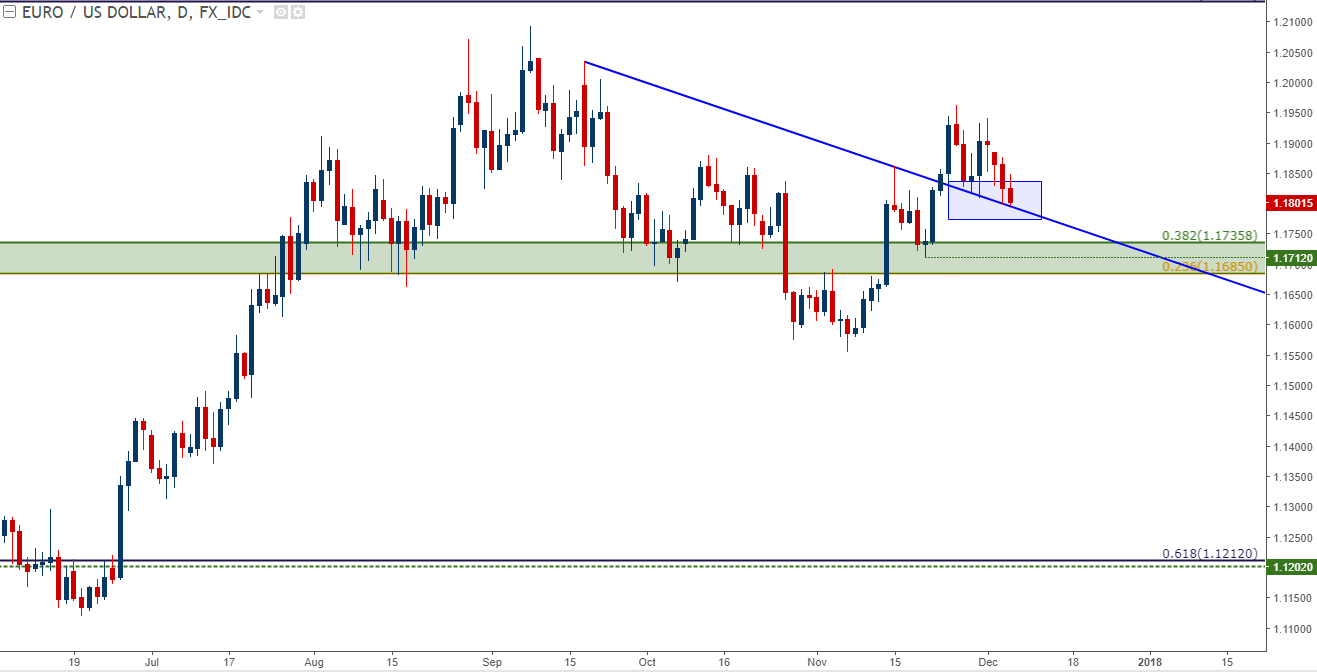
Chart prepared by James Stanley
--- Written by James Stanley, Strategist for DailyFX.com
To receive James Stanley’s analysis directly via email, please SIGN UP HERE
Contact and follow James on Twitter: @JStanleyFX


