


Talking Points:
- This morning brought the most recent Euro-Zone inflation numbers to the table, and the missed-print brought a quick support test in the Euro that, at this point, has been soundly faded out of the market.
- Retail traders continue to remain net short in EUR/USD with a current read of -1.57-to-1, as of this writing.
- Looking for trade ideas? Check out our trading guides. And if you’re looking for something more interactive in nature, check out our DailyFX Webinars.
To receive James Stanley’s Analysis directly via email, please sign up here
Over the past six weeks, the Euro has been on quite the ride. As we came into October, a vitally important ECB meeting sat on the calendar for later in the month, and the large expectation was that we’d finally hear the bank’s plans on what they were going to do with stimulus when the current program expired in December of this year. Given the improving slate of fundamentals, combined with the massive amount of stimulus that’s already taken place, the expectation was growing that we’d hear the ECB plot a strategy for exiting stimulus, with the eventual bump-higher in rates, perhaps even as early as 2018.
But when we got to the ECB rate decision in October, none of that was announced. The ECB simply extended their program into September of next year while reducing the amount of monthly bond purchases. There was no announcement for when the balance sheet might start being reduced, nor where there any warnings of pending rate hikes. As a matter of fact, the ECB said that they were planning on keeping rates at current levels for the foreseeable future, inferred to mean at least until the end of next year.
This essentially deflated the theme that had helped to drive the single currency higher for much of the year, with a hastening of the move in April after the first round of French elections resolved with a rather market-friendly outcome. The Euro drove higher as we moved throughout the year, but the October ECB rate decision finally broke EUR/USD below a key zone of support that had held the lows in the pair for the better part of three months. In short order, it looked as though that bullish theme in the Euro that had become so built-in throughout the year might finally turn around.
EUR/USD Daily: ECB-Weakness Last Two Weeks, Bulls Drive Prices Back Above Key Zone
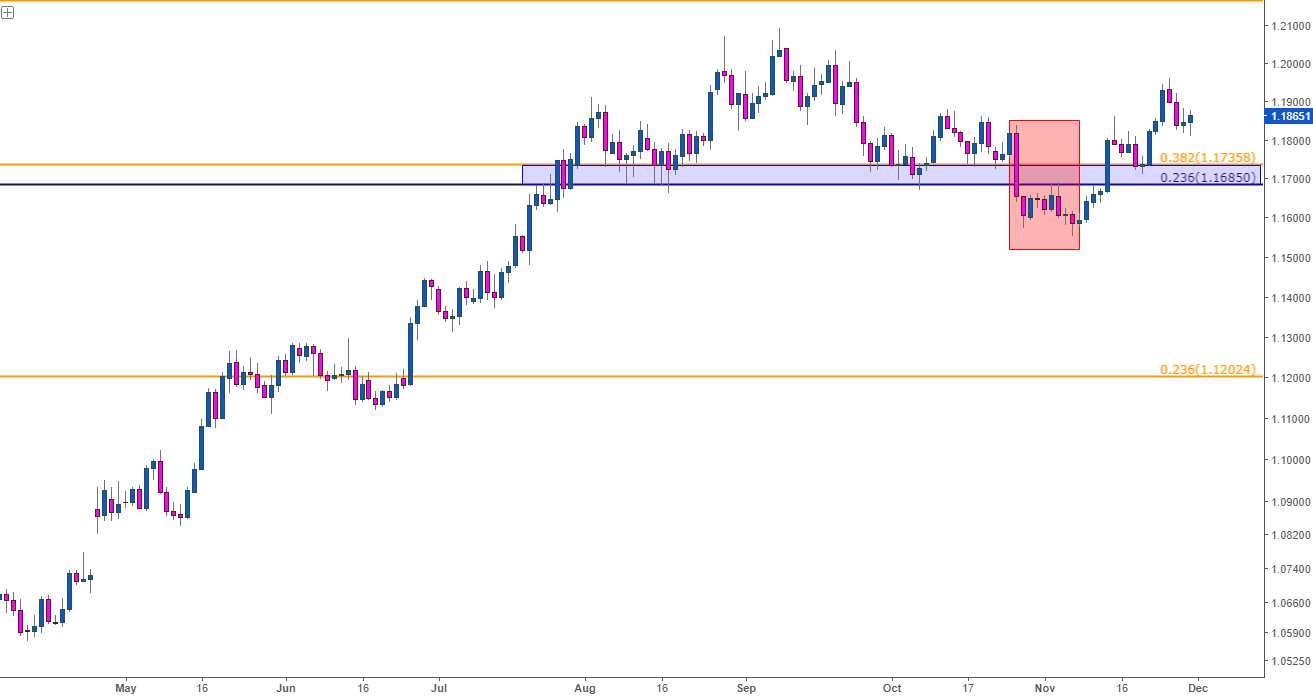
Chart prepared by James Stanley
The bearish theme in the Euro only lasted for a couple of weeks. We saw this take place through the first half of November, and we even saw the build of bearish structure around the Non-Farm Payrolls report earlier in the month.
Two weeks ago, when German GDP was released at a .8% read for Q3, amounting to a .6% read for the Euro-zone, that bullish theme began to come back with a vengeance. Within short order we were right back above that support zone, and surging towards a group of swing-highs that had showed up in October just ahead of the ECB’s rate decision. At that point, the bearish theme was on the rope and there were even bullish continuation possibilities starting to show. As we wrote, there were setups on both sides of the market that could be worked with.
As prices moved-up to test that group of prior swing-highs, a shooting star formation formed, which is a bearish reversal setup, and this played out for almost a full week, until prices ran into that support zone again. Bulls came back, pushed prices higher and we broke above resistance, further entrenching the bullish theme on the single currency.
EUR/USD Four-Hour: Bulls Return after German GDP (in blue); Support Shows at Top of Zone (Red)
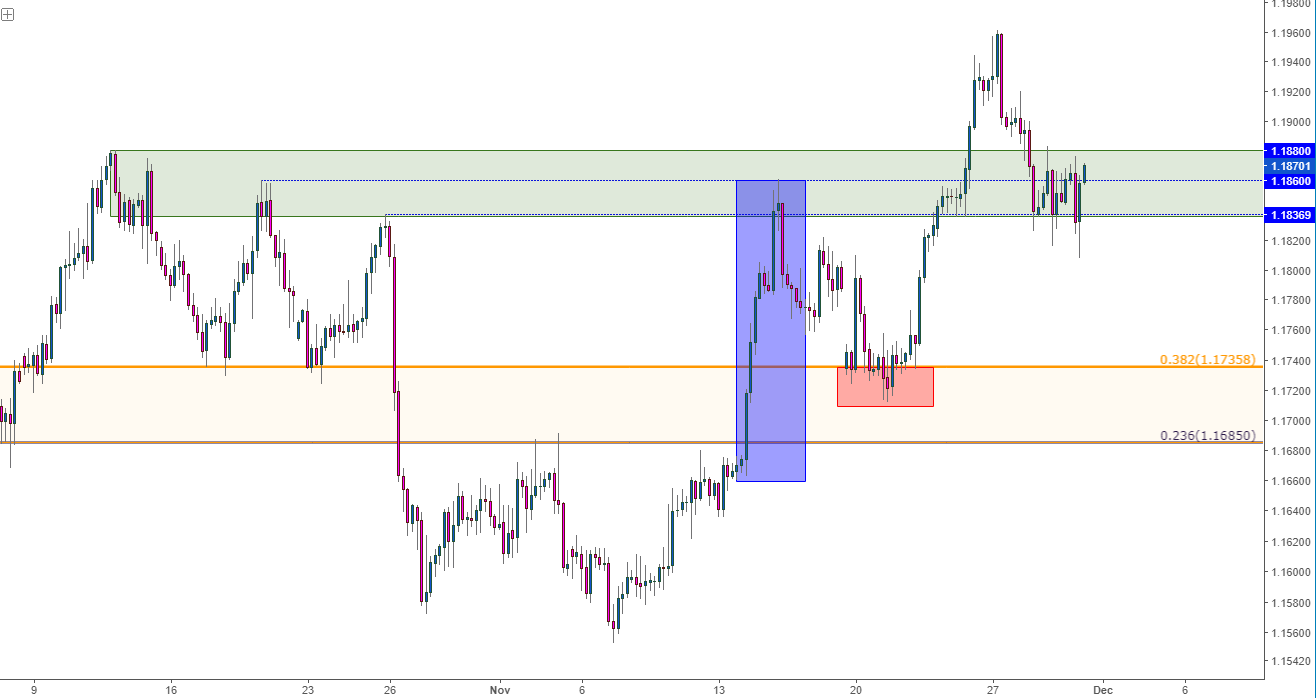
Chart prepared by James Stanley
This morning brought the most recent Euro-Zone CPI print to the table, and this came-in below expectations. The all items figure rose to an annualized 1.5% versus the expectation for a 1.6% bump, while core CPI came-in at .9% versus the expectation of 1.0% flat. Last month saw headline CPI at 1.4%, so we had a slight improvement there even though we missed expectations; and core was at .9% last month, so a flat read despite the expectation for a bit of improvement. Logically, this should amount to some element of Euro weakness as softer inflation produces a less threatening backdrop for the ECB as we move into 2018, with less impetus to nudge rates or tighten policy in response to stronger rates of inflation.
The net response was a drop in the Euro, but that was quickly bought by traders. Prices moved below the area of prior resistance from those October swing-highs, only to soon return. But, this did give us a technical lower-low shortly after another lower-high, so near-term price action could still be qualified as bearish here.
EUR/USD Hourly: Fresh Lower-Low after Euro-Zone CPI; Firm Bullish Response Follows
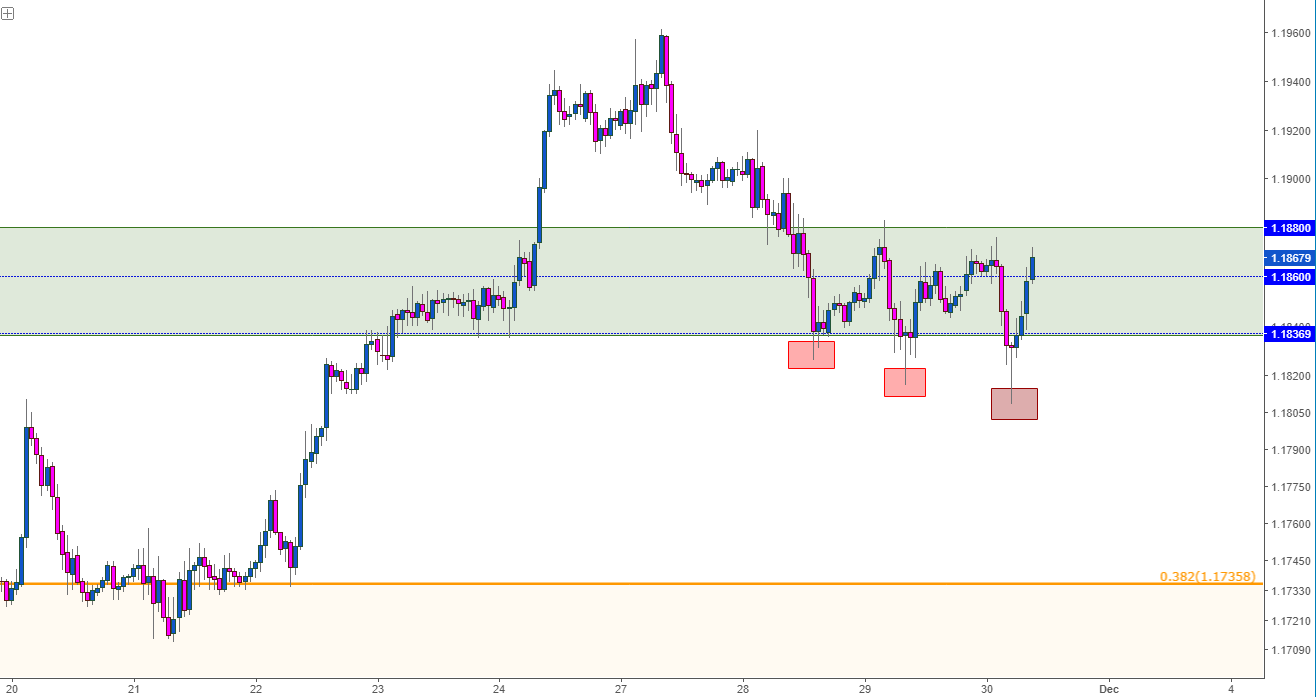
Chart prepared by James Stanley
Perhaps the most interesting part of this current observation is the follow-thru response. Bulls used this morning’s drop to add to long positions, and this highlights just how resilient the Euro has been this year even with the ECB remaining dovish, attempting to avoid a run of strength in the currency that may dampen inflation as we move into 2018.
On the daily chart, we can see where EUR/USD is attempting to hold higher-low support after the bullish burst over the past couple of weeks. Yesterday produced a Doji around support/prior resistance, and this morning’s down-side wick exposes the reversal that’s taken place around this morning’s CPI report.
EUR/USD Daily: Bulls Respond to Support/Prior Resistance; Potential for Bullish Continuation

Chart prepared by James Stanley
OPEC Deal Extended
The OPEC production cuts that have helped to support Oil prices were extended to the end of next year, as we’d discussed last week in our trading forecast on Oil. US Oil prices have been trading within a bearish channel over the past week, and this comes after an extremely bullish run that has lasted for a full five months.
This bearish channel began to show and support has come-in at a longer-term Fibonacci level. The price of 57.24 is the 38.2% Fibonacci retracement of the 2014-2016 major move. This level had helped to set resistance earlier in November with five consecutive trading days catching sellers at this level. After a quick correction, price action eventually mounted above this level; and this was being driven by a couple of different factors. We had the prospect of these production cuts being extended; but there was also a shutdown of the TransCanada pipeline that delivers Crude into Cushing, Oklahoma; the delivery point for WTI futures.
So, this was another supply constraint added on to the prospect of production being tempered well into next year. These dualing bullish factors helped Oil prices make a valiant attempt at the $59 level, and that’s when this current bull flag began to show.
WTI/USOil Hourly: Bull Flag Formation from Last Week’s Highs
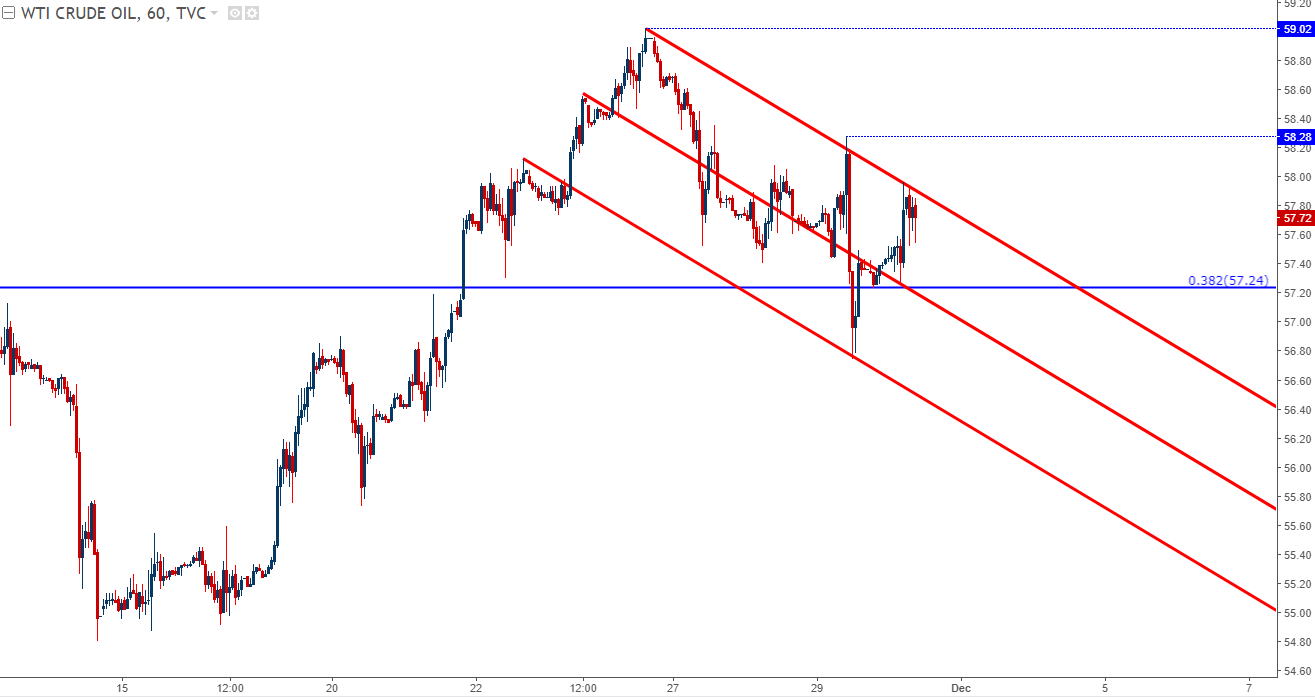
Chart prepared by James Stanley
A topside break of the flag opens the door for bullish continuation; and for those that’d like to approach the setup a bit more conservatively, awaiting a break of the prior swing-high around 58.29 could make the prospect of bullish extension more attractive.
WTI Daily: Support at Prior Fibonacci, Swing-High Resistance
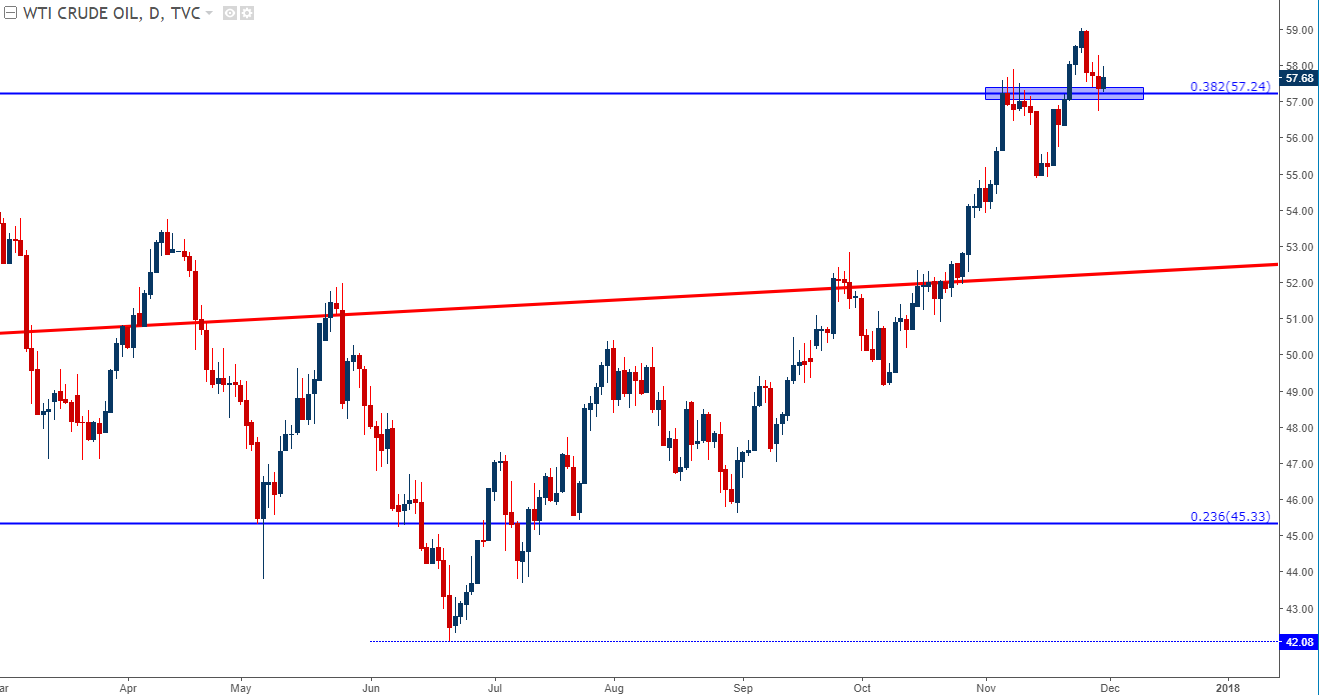
Chart prepared by James Stanley
--- Written by James Stanley, Strategist for DailyFX.com
To receive James Stanley’s analysis directly via email, please SIGN UP HERE
Contact and follow James on Twitter: @JStanleyFX


