


Talking Points:
- This morning’s NFP report came-in below expectations, producing a quick blip of USD-weakness against the recent trend of Dollar-strength. Correspondingly, EUR/USD checked the under-side of a key area of prior support, opening the door for downside continuation in the pair.
- EUR/USD Sentiment remains elevated at -1.84. Click here to access IG Client Sentiment.
- Looking for trade ideas? Check out our trading guides. And if you’re looking for something more interactive in nature, check out our DailyFX Webinars.
To receive James Stanley’s Analysis directly via email, please sign up here
This morning’s Non-Farm Payrolls report came-in below expectations, printing at +261k versus the expectation of +313k. While this is the largest number of jobs added in an NFP report in over a year, it’s still a sizable miss. But the miss on the headline number probably isn’t the most disconcerting aspect of this morning’s jobs report, as Average Hourly Earnings came-in underneath the 2.7% expectation, printing at 2.4%; well below last month’s 2.8% showing that helped to offset the terrible headline number of -33k.
This is relevant because it shows additional softness in inflation ahead of the Fed’s expected December hike. The expectations that have been building around that December move and, further, additional hikes in 2018 have finally started to bring some strength into the Dollar after a troubling first three quarters of the year. But it wasn’t anything directly Dollar-related that brought last week’s topside breakout, as USD surged after the ECB extended their QE program. This led-in to fresh three-month highs which have held throughout this week. On Wednesday we looked at a zone of support in DXY that runs from 94.30 up to 94.44. The 94.30 level comes from the 38.2% retracement of the 2014-2017 major move in DXY, and 94.44 comes from the swing-low that showed on Monday of this week.
U.S. Dollar via ‘DXY’ Four-Hour: Bullish Trend Holds Higher-Low Support After NFP
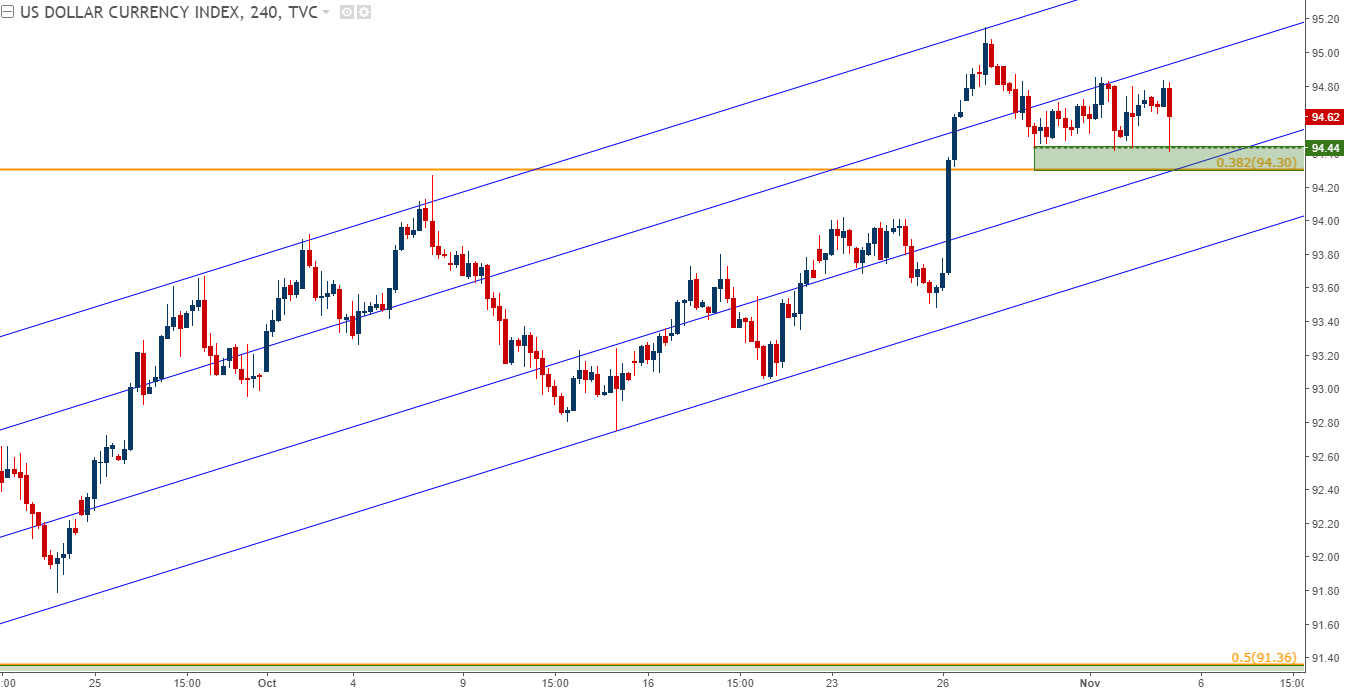
Chart prepared by James Stanley
Is this Enough to Deter Dollar Strength?
Given the current backdrop, likely not. With the ECB kicking the can for stimulus exit to sometime next year after last week’s dovish outlay, and with the Bank of England dressing up yesterday’s rate hike as a ‘one and done’, there are simply few economies looking at higher rates in the near-term; and this could further support long-USD flows after the back-breaking down-trend that showed in the first nine months of this year. On the four-hour chart below, we’re looking at a series of resistance levels based on this year’s price action that could be usable for topside continuation in USD. Traders can look for prices to test the next resistance level, at which point the higher-low support could be sought out at one of the prior resistance levels.
U.S. Dollar via ‘DXY’ Four-Hour: Top-Side Potential Resistance Levels Applied
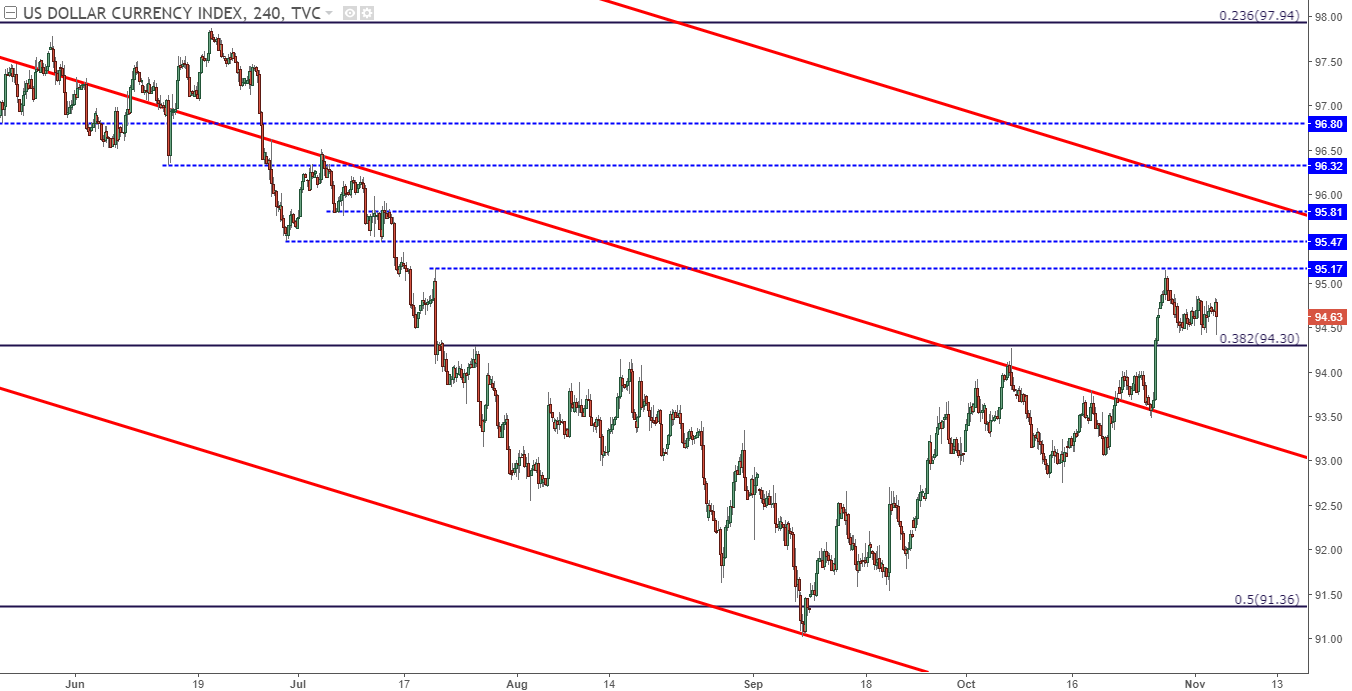
Chart prepared by James Stanley
EUR/USD Checks Resistance
As that quick blip of USD-weakness showed after NFP, EUR/USD moved up to catch resistance off of a key zone of prior support. This area of prior support had helped to substantiate the neckline of a prior head-and-shoulders pattern, and this zone held the lows in EUR/USD for the better part of three months.
EUR/USD Four-Hour: Resistance at Prior Zone Support

Chart prepared by James Stanley
Until last week, that is. What had driven the Euro-higher throughout the year was the prospect of a stimulus exit from the ECB, along with the potential for some small rate hikes next year. At last week’s ECB rate decision, the bank summarily dismissed those ideas while extending their QE program out to next September. They’re also planning on reinvesting dividends from those programs for the foreseeable future, and they mentioned that they’re planning on rates staying at present levels for an extended period of time, implied to mean rates aren’t moving until 2019, at the earliest.
So, the question then begs, is this enough of a backdrop to hold up an elevated EUR/USD spot as the Federal Reserve embarks upon what the bank expects to be a series of rate hikes? This can open the door for deeper down-side continuation, and there is a longer-term level of interest around the 1.1200 figure that can draw considerable attention from traders should this downside move develop further.
EUR/USD Daily: Deeper Retracement Exposes Down-Side Targets to Confluent 1.1200 Area
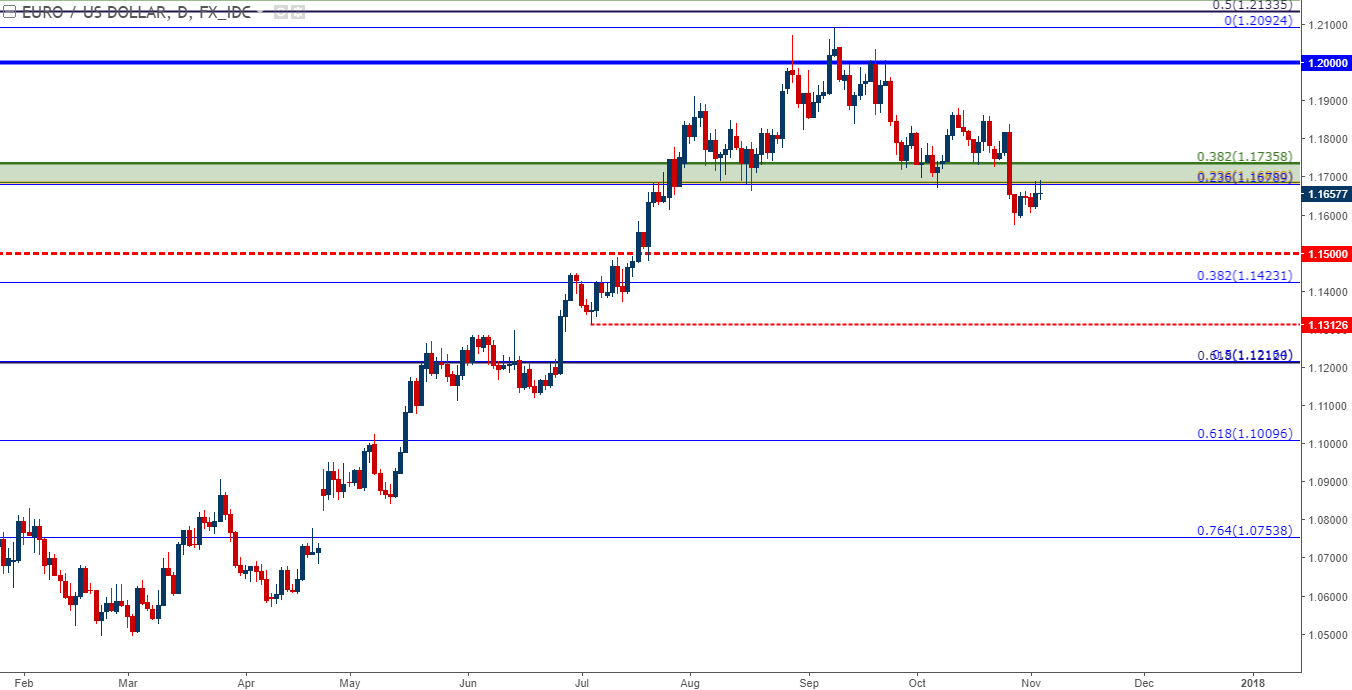
Chart prepared by James Stanley
Next Week’s Docket
Next week’s economic calendar is a bit quieter than the past few weeks with the numerous Central Bank offerings. Next week has but one major Central Bank hosting a rate decision, and that takes place on Wednesday with the RBNZ. Little is expected out of that meeting, so we may see more focus paid towards Central Banker speeches from Haruhiko Kuroda of the BoJ on Sunday night/Monday morning, and Stephen Poloz of the BoC on Tuesday afternoon. Chinese data in the tail end of next week will likely have some bearing on risk tolerance, with Chinese inflation issued on Wednesday night/Thursday morning and New Yuan Loans on Friday morning.
USD/CAD is particularly interesting as we move into next week. The pair put in one of the more aggressive trends during this summer when USD-weakness and CAD-strength was all the rage, but since the U.S. Dollar has started to budge-higher, CAD-weakness has begun to show; and that previously aggressive down-trend has turned into a promising up-trend, as we see below on the four-hour chart of USD/CAD.
In yesterday’s article, we looked at a series of potential support levels. Price action is currently finding support on the third of the four levels we looked at, and just below our current area of support is another zone around a key Fibonacci level at 1.2672. If we do see buyers show-up to offer support around either of these prices, the door is opened for bullish continuation strategies, with stops plotted below the prior swing-low around 1.2609.
USD/CAD Four-Hour: Pullback After U.S., Canadian Jobs Numbers
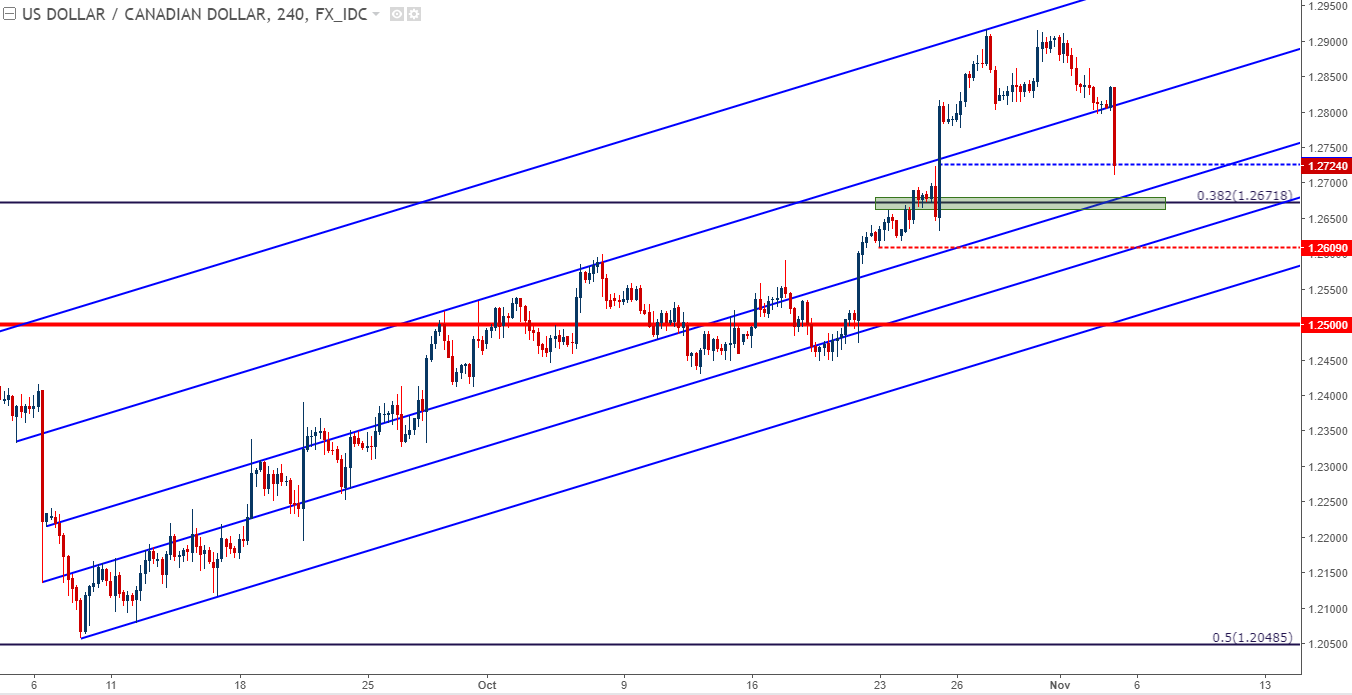
Chart prepared by James Stanley
--- Written by James Stanley, Strategist for DailyFX.com
To receive James Stanley’s analysis directly via email, please SIGN UP HERE
Contact and follow James on Twitter: @JStanleyFX


