


Talking Points:
- The U.S. Dollar is moving off of the resistance zone we looked at yesterday, and this opens the door for a couple of different interesting areas for longer-term support to show. We look at this DXY and along with a related theme in EUR/USD below.
- EUR/USD Sentiment remains stretched at -1.67. Click here to access IG Client Sentiment.
- Looking for trade ideas? Check out our trading guides. And if you’re looking for something more interactive in nature, check out our DailyFX Webinars.
To receive James Stanley’s Analysis directly via email, please sign up here
In yesterday’s article , we looked at the U.S. Dollar putting in bullish indications after the ECB meeting from two weeks ago. When the ECB kicked the can on stimulus taper, the Euro sank and the U.S. Dollar shot-higher as capital flowed out of the single currency. The day after ECB saw prices in DXY move up to the psychological level of 95.00, which was a fresh three-month high in the Greenback; and this includes a break above a key zone of prior resistance that had run from 94.08-94.30. But after running into the 95.00 level, bulls have had a difficult time mustering the motivation to continue the move. On the chart below, we’re looking at three different approaches above 95.00, each of which have failed up to this point:
U.S. Dollar via ‘DXY’ Hourly: Rocket-Higher After ECB (Green), Resistance Sets In ~95.00

Chart prepared by James Stanley
After the first failed test to run above 95.00, higher-low support began to show around 94.44. We looked at this level as support last week, and we’ve now seen four different support tests at this price. With price action now making a fast approach towards a fifth test, traders would likely want to exercise a bit more patience to see if this pullback runs a bit deeper. That prior zone of resistance at 94.08-94.30 has yet to be tested as support after acting as resistance for more than three months. This can be an operable area to be watching for longer-term support in the Greenback in the effort of implementing top-side plays.
U.S. Dollar via ‘DXY’ Four-Hour: Prior Zone of Resistance to Offer Support for Longer-Term Plays
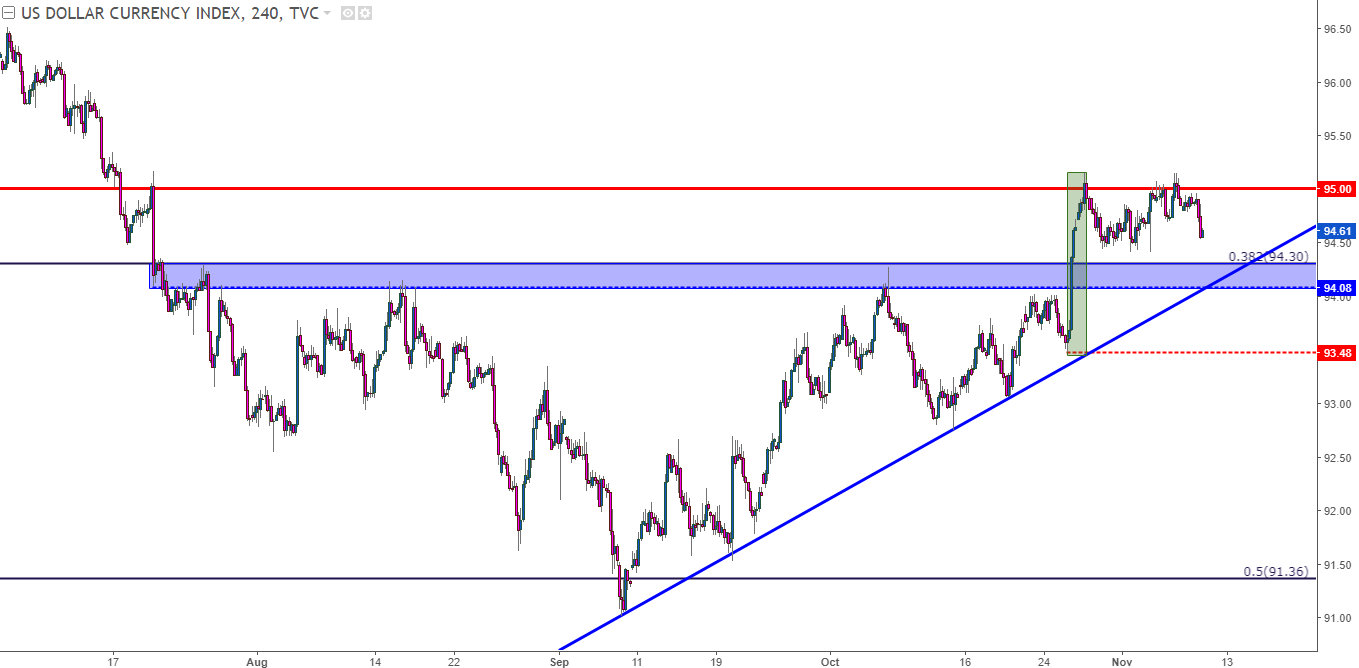
Chart prepared by James Stanley
On the side of Dollar strength, the pair that will probably continue to elicit the most attention will be EUR/USD. The Euro makes up a large chunk of the DXY U.S. Dollar index with a greater than 57% allocation. So when we see a pronounced move in the Greenback as we have over the past couple of weeks, the Euro is likely at least partially responsible. At this point, the prospect of a continuation of USD-strength appears to be aligned with similar prospects of a continuation of Euro weakness.
That Euro weakness has been visible since the ECB rate decision: With the potential for taper or stimulus exit or, perhaps even higher rates at some point in 2018 functioning as the primary driver of this year’s bullish trend in EUR/USD; the fact that these have been ruled out can open the door for a deeper retracement lower. Thus far, this has been echoed in price action since ECB as EUR/USD has continued to move down to fresh lower-lows and lower-highs.
Want to see how the Euro and U.S. Dollar have held up to our DailyFX Quarterly Forecasts? Click Here for Full Access.
This morning produced a slightly deeper pullback: A series of data points released earlier all pointed towards positivity for the Euro-zone as additional signs of recovery become evident. And this is somewhat par for the course of 2017, where improving European data coming in above expectations are what fed those machinations that rates might move up next year as the ECB attempts to get in-front of building inflation. But throughout the year, the ECB has remained dovish, showing no signs of letting up on their gargantuan stimulus outlay. When we finally got to the October ECB meeting, the bank announced an extension of stimulus while sharing their view that rates will stay at current levels for the foreseeable future, inferred to mean until 2019, at the earliest for any potential rate moves; and this effectively nullified the prospect of tighter policy options in the near-term.
The big question at this point for the Euro is whether sellers will respond to resistance. EUR/USD bounced from a key zone of support for the better part of three months as we moved into the October ECB meeting. This zone is comprised of two Fibonacci retracement levels derived from longer-term studies, and the area runs from 1.1686-1.1736. Also of interest is the 23.6% retracement of this year’s bullish move that comes in just a few pips below that zone at 1.1679.
EUR/USD Daily: Falls & Runs Below Key Support Zone post-ECB
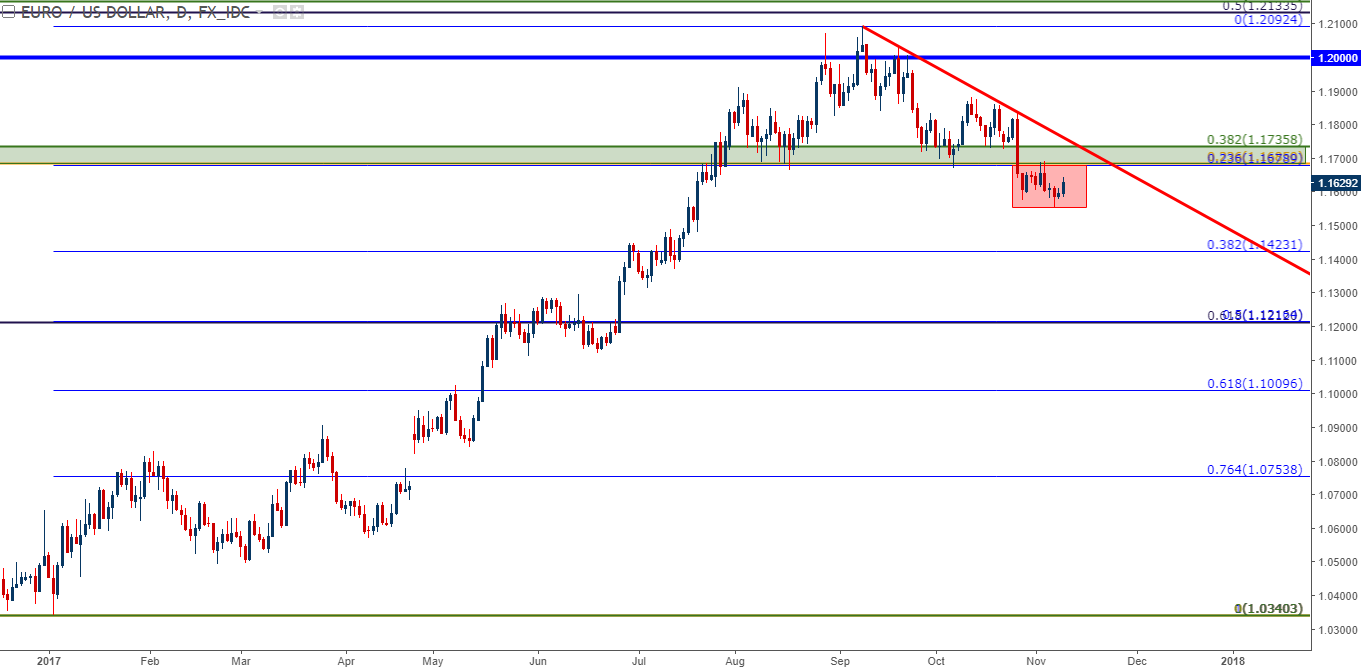
Chart prepared by James Stanley
It was just a week and a day after that ECB outlay that we got Non-Farm Payrolls in the early-portion of November. This disappointing print brought upon a quick dose of USD-weakness, but that was quickly bought after prices tested short-term support in DXY around that 94.45 level we looked at earlier. But in EUR/USD, another key level/zone came-into play, as the bottom portion of this support area helped to offer resistance as sellers came back-in to take over.
EUR/USD Four-Hour: Bears Take Over With Lower-Lows/Highs, Resistance at Prior Support (Red)

Chart prepared by James Stanley
Given the above facts, it would appear as though we’re nearing an interesting juncture to confirm the potential for a bigger-picture EUR/USD sell-off or, as a connected theme a continued run of USD-strength. In EUR/USD, the pre-ECB group of swing-highs can serve as anchor points for short-side plays, in which stops can be investigated above those levels so that the position stays alive as long as longer-term lower-lows/highs continue. This also exposes that prior zone of support that runs from 1.1685-1.1736 for bigger-picture resistance to come-into play. At this point, the quick swing-highs that showed in EUR/USD around last week’s NFP report remain vulnerable, and if they are taken-out, this would not necessarily nullify the potential for a continuation of bearish price action in the pair.

Chart prepared by James Stanley
--- Written by James Stanley, Strategist for DailyFX.com
To receive James Stanley’s analysis directly via email, please SIGN UP HERE
Contact and follow James on Twitter: @JStanleyFX


