


Talking Points:
- The U.S. Dollar continues to claw back towards a key resistance zone that runs from 94.08-94.30.
- Are we on the cusp of a bigger picture move of USD strength? It’s too early to say for certain, but if we do see that theme continue, AUD/USD and USD/JPY could be interesting for such scenarios.
- Want to see how GBP and USD are holding up to the DailyFX Forecasts? Click here for full access.
To receive James Stanley’s Analysis directly via email, please sign up here
U.S. Dollar Stretches Towards Resistance
One of the strongest trends across FX markets this year is in question as the U.S. Dollar continues to trade higher. In the first three quarters of 2017, the Dollar faced a drawdown that saw as much as -12.33% of its value erased. After setting a fresh low in early-September, the Greenback began to move-higher into the close of Q3, but in the first week of the quarter, an abysmal NFP print combined with a big zone of resistance helped to punch the Dollar lower. That bearish action lasted for most of last week, and on Friday when we got CPI for the month of September showing 2.2% inflation in the U.S., bulls eventually returned to bid prices higher. At this stage, it seems as though a re-test of this resistance zone will soon be in the cards. The bigger question will be how sellers respond and whether or not they allow this zone of resistance to become breeched.
U.S. Dollar via ‘DXY’ Four-Hour: Fast Approaching Key Resistance Zone

Chart prepared by James Stanley
On the above chart, we’ve identified those inflection points of NFP (in purple) and CPI (in Green). The zone of resistance that we’re referring to consists of the 38.2% Fibonacci retracement of the 2014-2017 major move in DXY combined with a group of swing-highs that showed in August around 94.08.
If we do see resistance come in short of the prior high that had printed earlier in October at 94.27, USD weakness could be attractive under the presumption that the bigger picture bearish trend will remain in order. But – if we do get a break of that resistance zone, we’ll be looking at fresh three month highs in a market that was heavily short and getting further squeezed. That could lead to additional upside as resistance levels at 95, 95.50, 96.30 become interesting as topside targets.
U.S. Dollar via ‘DXY’ Daily: 2017 Down-Trend Test with Additional Resistance Applied
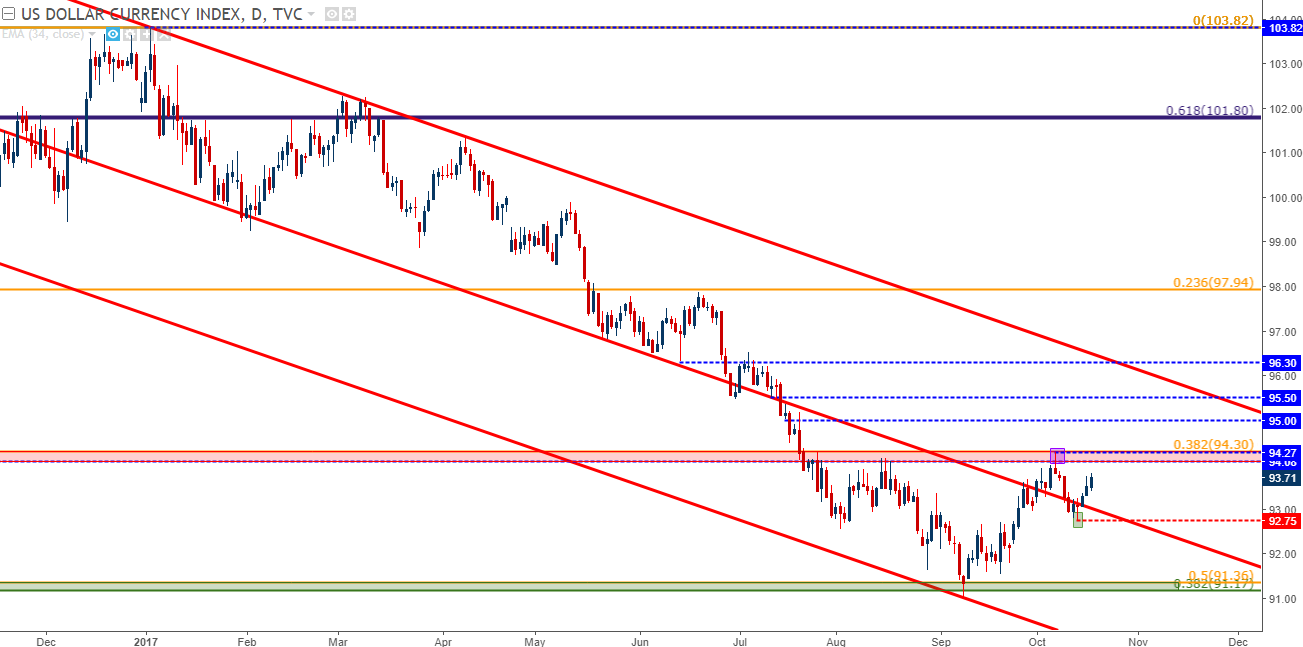
Chart prepared by James Stanley
For those looking for USD-strength plays, there are a couple of markets that are interesting. While many are looking to fade off the Euro or to get short on the British Pound ahead of a potential rate hike, there are economies in Japan and Australia that won’t likely be looking at interest rate hikes or tighter policy options anytime soon. This can provide for a bit more of a softened backdrop for those looking at USD-strength plays, as those currencies won’t have to contend with the prospect of tighter policy options, at least to the degree of what’s being seen around Europe.
Yen Weakness Shows Back Up
There are quite a few reasons for the Yen to remain as attractive as a funding currency, chief of which is the fact that the Bank of Japan remains uber-dovish. While the ECB has to contend with QE-taper and the Bank of England looks at rate hikes in the effort of stemming inflation; the Bank of Japan has no such concerns. Inflation remains weak, even as growth continues in a rather consistent fashion. There are little hopes for the BoJ changing stance anytime soon, and at the most recent rate decision, we actually saw a dissenting vote that was looking for even more stimulus.
But this isn’t exactly a free trade: Worries around North Korea have shown boosts of Yen strength around risk aversion, and this weekend brings early Japanese General Elections. The economic stance of the Bank of Japan was very much driven by the 2012 campaign of current PM Shinzo Abe. If Mr. Abe does face upset in this weekend’s elections, even if indirectly with his LDP party losing seats, it could potentially bring questions around the continued uber-dovish stance of the BoJ. This risk appeared to settle a bit after the leader of the newly formed opposition party denoted that she saw no need to change economic stances; but if an upset does happen, it would be unwise to completely discount the prospect of Yen strength.
As we walk towards this weekend’s election, Yen weakness continues to show. Monday of this week saw higher-low support show at the 38.2% retracement of the July-September bearish move. Prices have quickly moved up to the 23.6% retracement of that move, and after a brief amount of resistance, buyers budged it over the edge. If we take out the prior swing-high of 113.44, a re-test of resistance around 114.50 becomes attractive.
USD/JPY Four-Hour: Bullish Trend Resumes After 38.2% Pullback
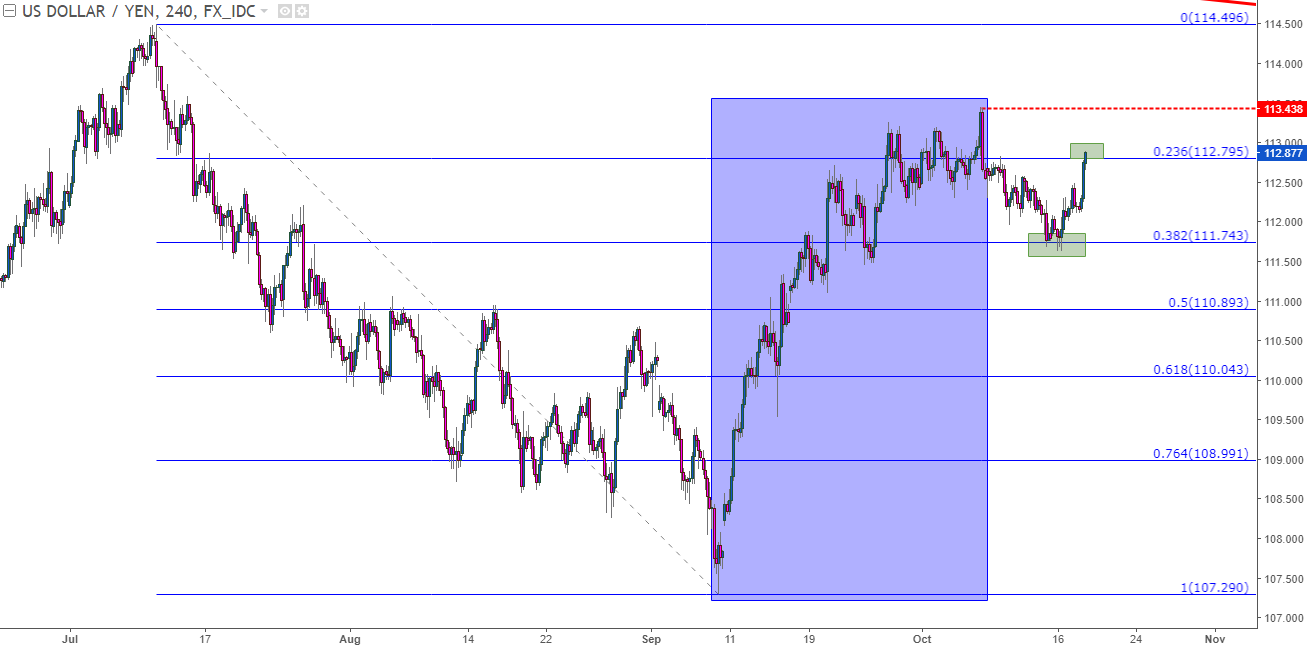
Chart prepared by James Stanley
On a longer-term basis, this sends USD/JPY above a key zone of big-picture support. We’ve been looking at the zone that runs from 111.61-112.43, and after gyrating within that zone for most of last week, bulls have responded to push prices-higher.
USD/JPY Hourly: Gyration Through/Around Longer-Term Support Zone

Chart prepared by James Stanley
Aussie Weakness
Also of interest on the long-side of USD is the potential for a deeper move in AUD/USD. Aussie set a lower-low shortly after the start of Q4, and it appears as though we’re seeing sellers respond to offer lower-high resistance. This could be interesting for downside continuation plays, and tomorrow brings Australian employment numbers, and this can certainly keep the currency on the move.
The pair is currently finding support and resistance on a couple of longer-term Fibonacci retracements, as we show below. In dark blue, we’re looking at the major move from the 2016 low up to the 2017 high, and in green, we’re looking at the May 2016 low up to that same high (referred to as the ‘secondary move’ from here). Resistance showed-up on Friday at the 23.6% retracement of the secondary move, and this comes just a week after support was set on the 38.2% level. And the past two days have shown support at the 23.6% retracement of the primary move.
AUD/USD Daily: Longer-Term Fibs Helping to Set Near-Term Support, Resistance
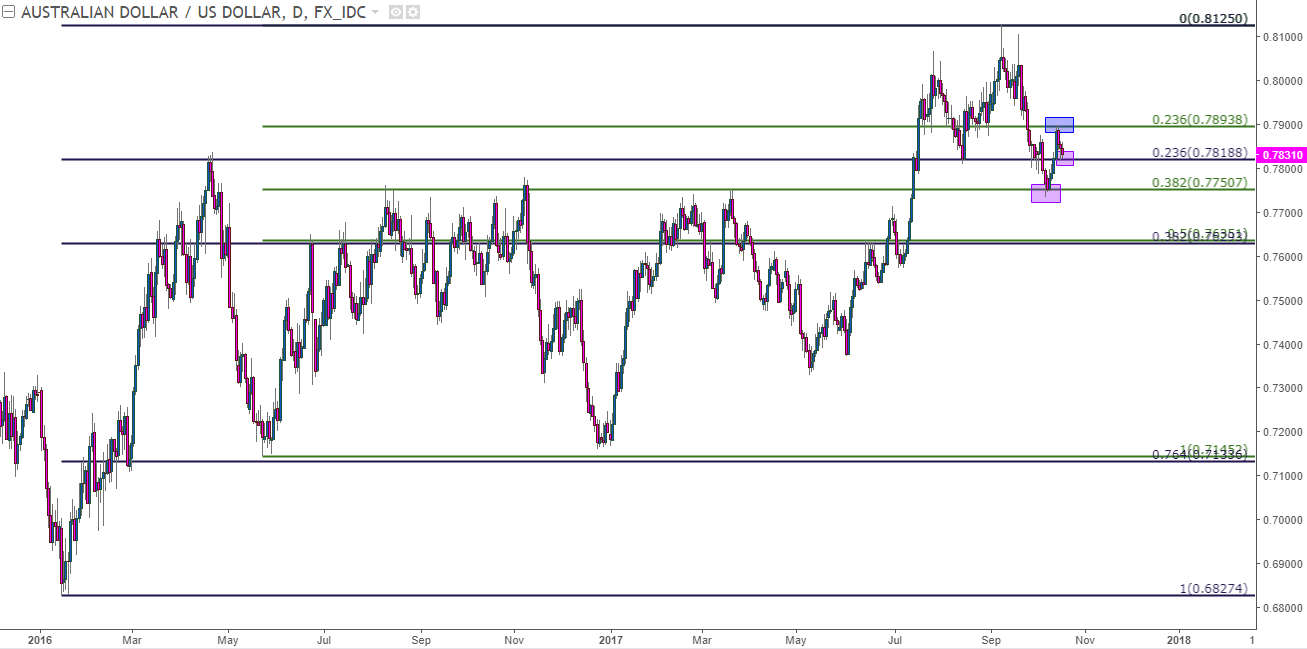
Chart prepared by James Stanley
On the four-hour chart below, we’re getting a bit closer to this recent move, and we can see where this recent bout of resistance came-in around last week’s CPI print. A down-side break of current support around .7818 opens the door for a re-test of .7751; and if we’re able to take-out that level, a confluent batch of support sits around .7635 that could become attractive for down-side targets.
AUD/USD Four-Hour: Prior Swing-Support Around .7750, Confluent Support Around .7630

Chart prepared by James Stanley
--- Written by James Stanley, Strategist for DailyFX.com
To receive James Stanley’s analysis directly via email, please SIGN UP HERE
Contact and follow James on Twitter: @JStanleyFX


