


Talking Points:
- USD Strength has continued to show after DXY set a fresh 2.5 year low earlier this week.
- The next few weeks bring a heavy outlay of risk to global markets: Tomorrow brings Non-Farm Payrolls, next week is a pivotal ECB rate decision and two weeks later we get a FOMC meeting where many are expecting the bank to announce the beginning of balance sheet reduction.
- Want to see how USD and EUR/USD has held up to our Q3 forecast? Click here for full access.
To receive James Stanley’s Analysis directly via email, please sign up here.
Over the past few days, we’ve been zeroing-in on the bullish move taking place in the U.S. Dollar. This had begun to show after DXY had lurched down to a fresh 2.5 year low earlier in the week; but after that happened, sellers have appeared to dry up as this move of Dollar strength has continued unabated. So far, this constitutes a jump of 1.7% off of this week’s lows, which we’re looking at on the chart below:
U.S. Dollar via ‘DXY’ Hourly: V-Shaped Reversal, Short-Term Resistance Under-Side of Trend-Line
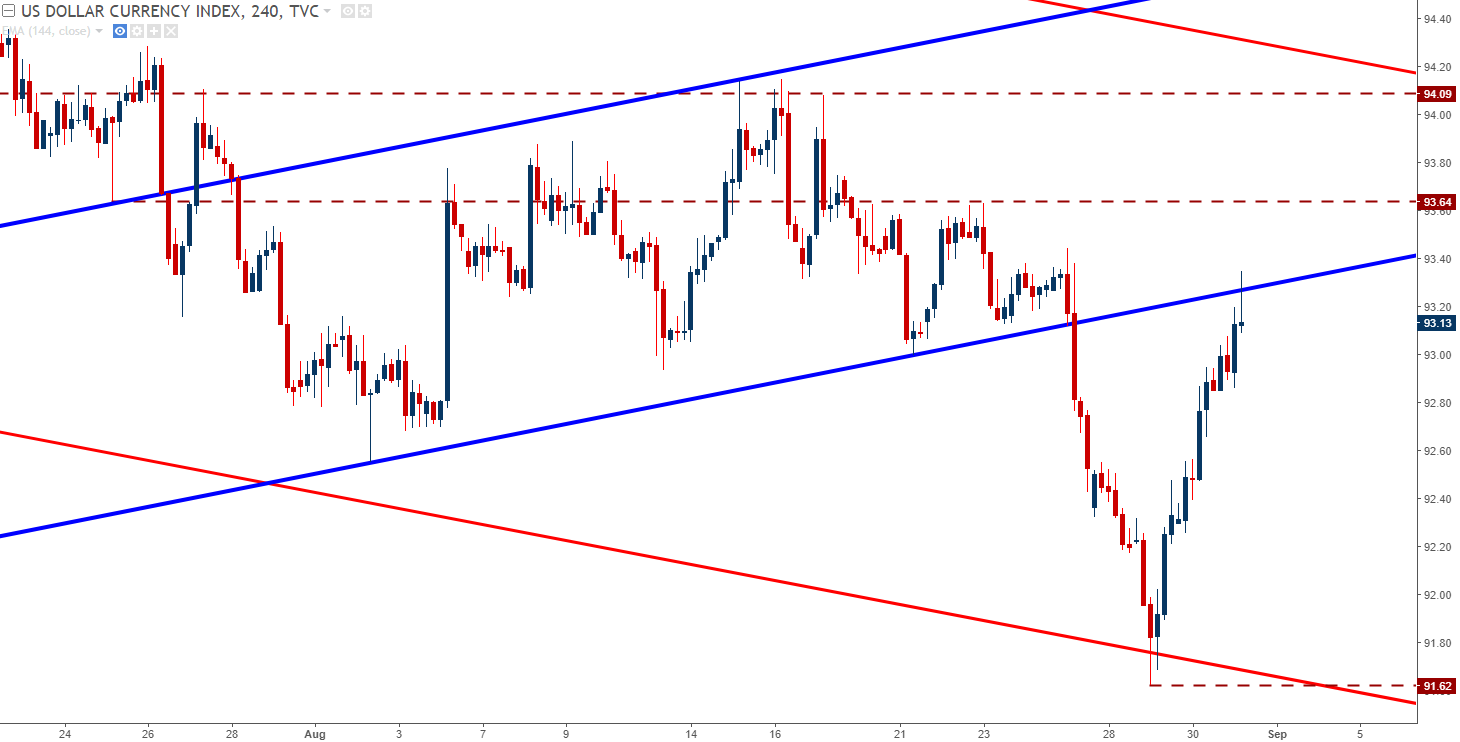
Chart prepared by James Stanley
The natural question here is whether this move has continuation potential, or more aptly stated – is this something that can turn into a predominant theme, or is this just a corrective move in the bigger picture bearish trend? With a pivotal NFP report on the docket for tomorrow, we will likely get a clue as to which direction this situation might roll-out, and next week, we hear from the European Central Bank and two weeks later, we hear from the Fed.
Given how climactic September may turn out to be, and also given how much importance is being associated with the potential stimulus exit from the ECB along with what many are expecting to be the introduction of balance sheet reduction from the Federal Reserve, it makes sense that we might see traders closing up positions in robust trends ahead of this outlay of risk. But – given the heavy importance of the drivers that will be availing themselves, retracements in bearish trends can certainly extend until we have a bullish scenario to work with.
The fireworks begin tomorrow with Non-Farm Payrolls for the month of August. The key here is how the Dollar responds to resistance around tomorrow’s print, as this can highlight two important points: A) The health in American labor markets ahead of a key meeting at the Federal Reserve and B) How aggressively bears may defend resistance, or whether we’re seeing a shift in sentiment that can continue carrying the Dollar higher into next week’s ECB announcement.
On the chart below, we’re looking at a series of resistance levels in DXY that can further confirm this bullish move, and below that – we’re extrapolating this theme in the Dollar to look at how traders can approach the more popular major currency pairs.
U.S. Dollar via ‘DXY’ Hourly: Breaks of Resistance Open Door to Bullish Continuation
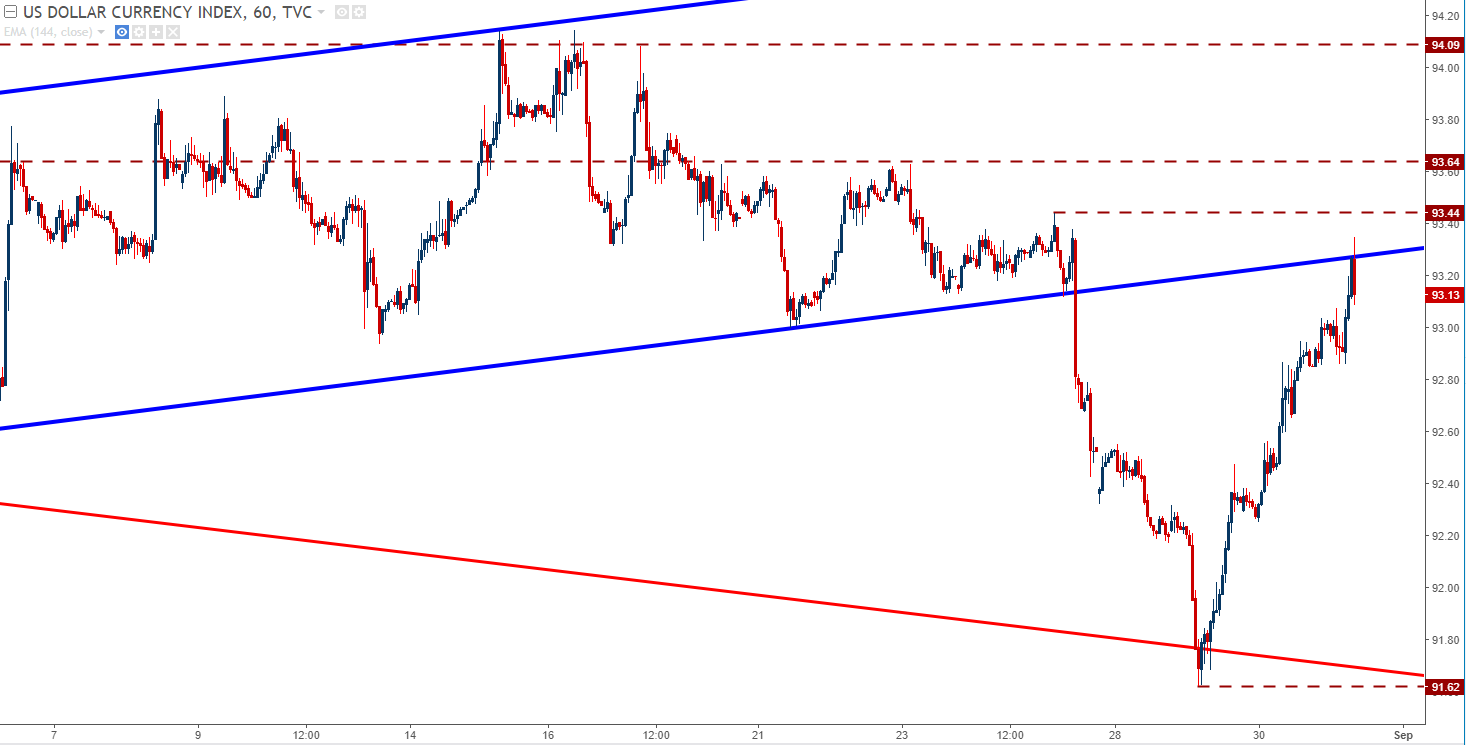
Chart prepared by James Stanley
EUR/USD Drop Deepens
If this recent bout of strength in USD flails-out, as can be expected given the veracity of the prior bearish trend, this will likely be the most attractive area to fade this recent topside run. We had looked at a reversal setup of the bullish move in EUR/USD in Tuesday’s webinar, and that theme continues to run on short term charts as the retracement has continued. But - this is where bears will likely want to be very careful, as we’re now seeing what could be a pretty attractive area of support in the bullish trend in the pair. If support doesn’t hold above 1.1817, traders will likely want to look for a deeper move towards the ‘bigger picture’ support zone that runs from 1.1685-1.1736:
EUR/USD Four-Hour: Two Zones of Support for Bullish Continuation Approaches
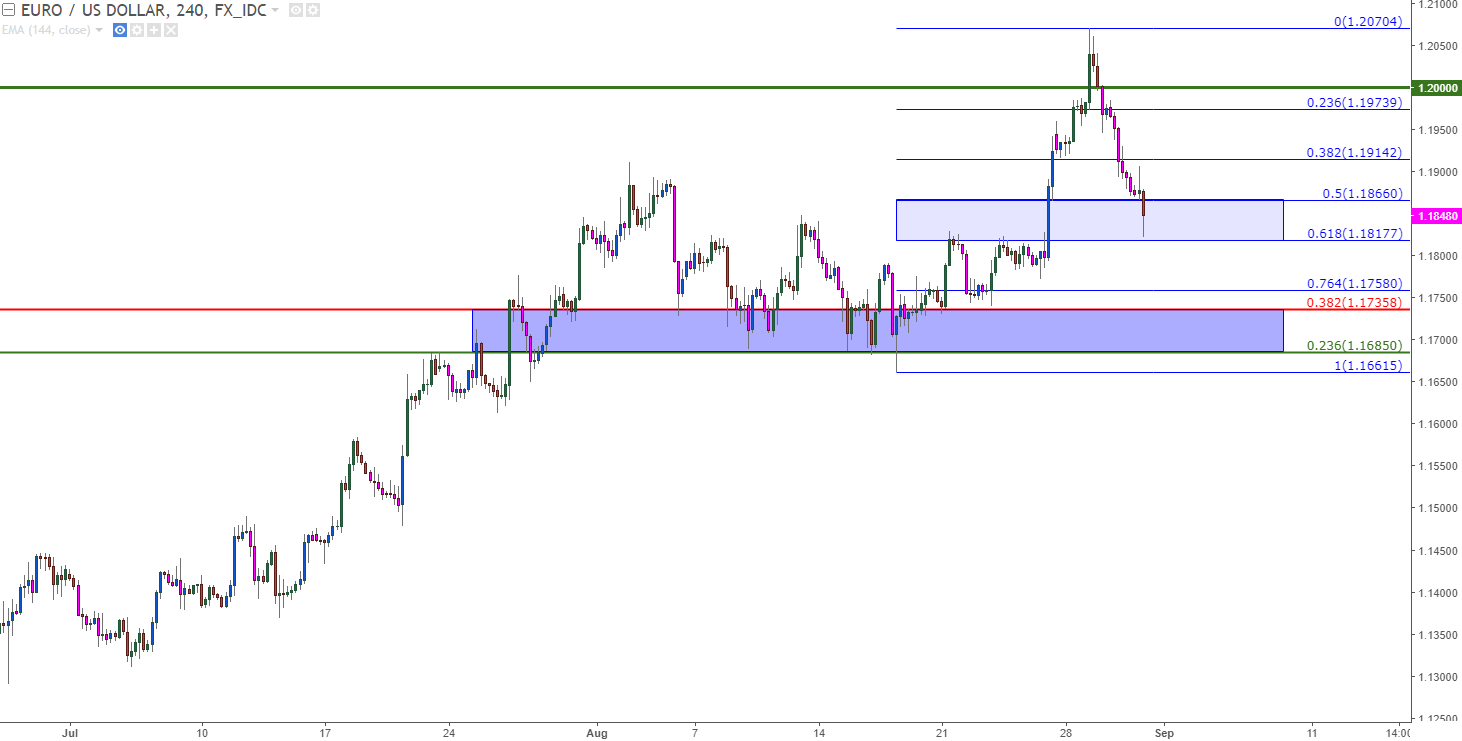
Chart prepared by James Stanley
GBP/USD Continues Reversal From Under-Side of Trend-Line
When we lined up our Analyst Picks around the Dollar ahead of last week’s Jackson Hole Economic Symposium, GBP/USD was the favored vehicle for USD-strength, largely on the basis of the continued dovish stance from the Bank of England that is unlikely to change until it has to. Meaning inflation of greater than 3%. We’re not there yet, and as inflation has started to soften in the U.K., from 2.8% in May to 2.6% in June and July, there is little reason to begin expecting that this may change. This has kept sellers active in the pair, and we’re approaching a key level of support around 1.2850.
This could be attractive for a longer-term run of USD strength, particularly if a quick bout of Dollar weakness shows up tomorrow around NFP.
GBP/USD Four-Hour: Cable Near Support, Potential Lower-High Resistance 1.2900-1.2929

Chart prepared by James Stanley
USD/JPY Bursts Higher – Right Side of the Range Ready to Go?
While the U.S. Dollar was bursting down to fresh 2.5 year lows earlier this week, USD/JPY was churning around support of a four-month range that’s held really well, as we look at below:

Chart prepared by James Stanley
As we’ve been discussing, for scopes of USD-strength, the bullish side of this range in USD/JPY could be attractive because, at the least, risk can be identified and more efficiently managed given this swath of prior support. But – one downside with playing a short-term reversal in the direction of a longer-term range is the fact that there are numerous points of resistance that can come into-play on the way back-up, as is the situation we have now in USD/JPY.
On the chart below, we’re looking at a series of potential levels derived from longer and intermediate-term Fibonacci studies. The next level of importance is at 111.15, as a break above this zone takes out the August swing highs to spell a fresh monthly high. If this can take place, a move up to the zone that runs between ¥111.61-112.40 could offer some longer-term resistance, at which point support in the zone from ¥111.00-111.15 could be an attractive area for bulls to investigate adding or taking on longer-term exposure.

Chart prepared by James Stanley
--- Written by James Stanley, Strategist for DailyFX.com
To receive James Stanley’s analysis directly via email, please SIGN UP HERE
Contact and follow James on Twitter: @JStanleyFX


