


- For trading ideas, please check out our Trading Guides. And if you’re looking for something more interactive in nature, please check out our DailyFX Live webinars.
To receive James Stanley’s Analysis directly via email, please sign up here.
Next week brings the widely-watched Jackson Hole Economic Symposium, and an appearance from ECB President Mario Draghi and a speech from Fed Chair Janet Yellen are sure to keep market interest revolving around this event. Much as we saw in 2016, the U.S. Dollar has spent most of the year heading-lower. While a low was set in May of last year, that low has yet to avail itself for 2017; but at last year’s Jackson Hole Symposium, the one-two combo of Janet Yellen and Fed Vice Chair Stanley Fischer helped to evoke a bullish move in the Greenback as they warned of upcoming rate hikes.
One Presidential Election and three rate hikes later, we have a veritable mess in the U.S. Dollar. Prices in DXY are currently trading below the low from last August. We’ve even seen last August’s swing-low come-in as near-term resistance on DXY, and this highlights just how aggressive this year’s sell-off in the Greenback has been. While the Dollar remains pinned down towards one-year lows, a bear flag formation has begun to show, as we discussed earlier this week.
U.S. Dollar Hourly via ‘DXY’: Bear Flag Formation
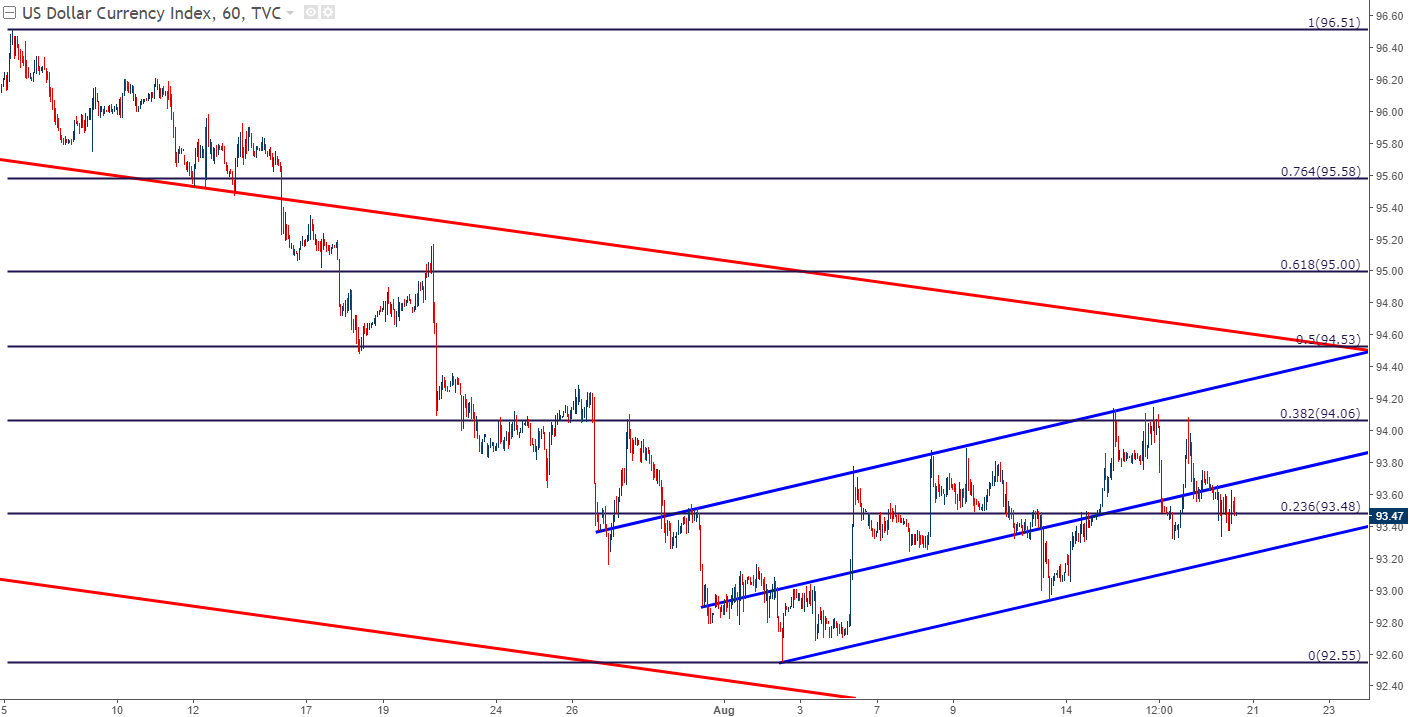
Chart prepared by James Stanley
This opens the door for setups on either side of the Greenback, which we look at below. We had discussed these setups at length in our Thursday webinar, and if you’d prefer a video accompaniment, you’re more than welcome to check out the video of that archived event.
Bullish EUR/USD for USD-Weakness Continuation
The Bullish EUR/USD trade of 2017 appears to be finally facing some element of a test. After a near-parabolic move through July ran the pair up to fresh yearly highs, bulls have started to show waning motivation. We’ve been discussing a zone of confluent support in EUR/USD from 1.1685-1.1736, which up to this point has held, at least on a relative basis. But as the lows come-in a bit lower and as the highs taper off a bit shorter, the prospect of a deeper retracement begins to look a bit more attractive. The zone around 1.1600 could be particularly attractive for a deeper retracement in the pair, as this can open the door for bullish continuation of the longer-term trend. Alternatively, a top-side break of the prior swing-high at 1.1790 would entail a bullish break of the bull flag, which can also open the door to bullish continuation strategies.
EUR/USD Hourly: Bull Flag Remains, Deeper Support Sought for Bullish Continuation
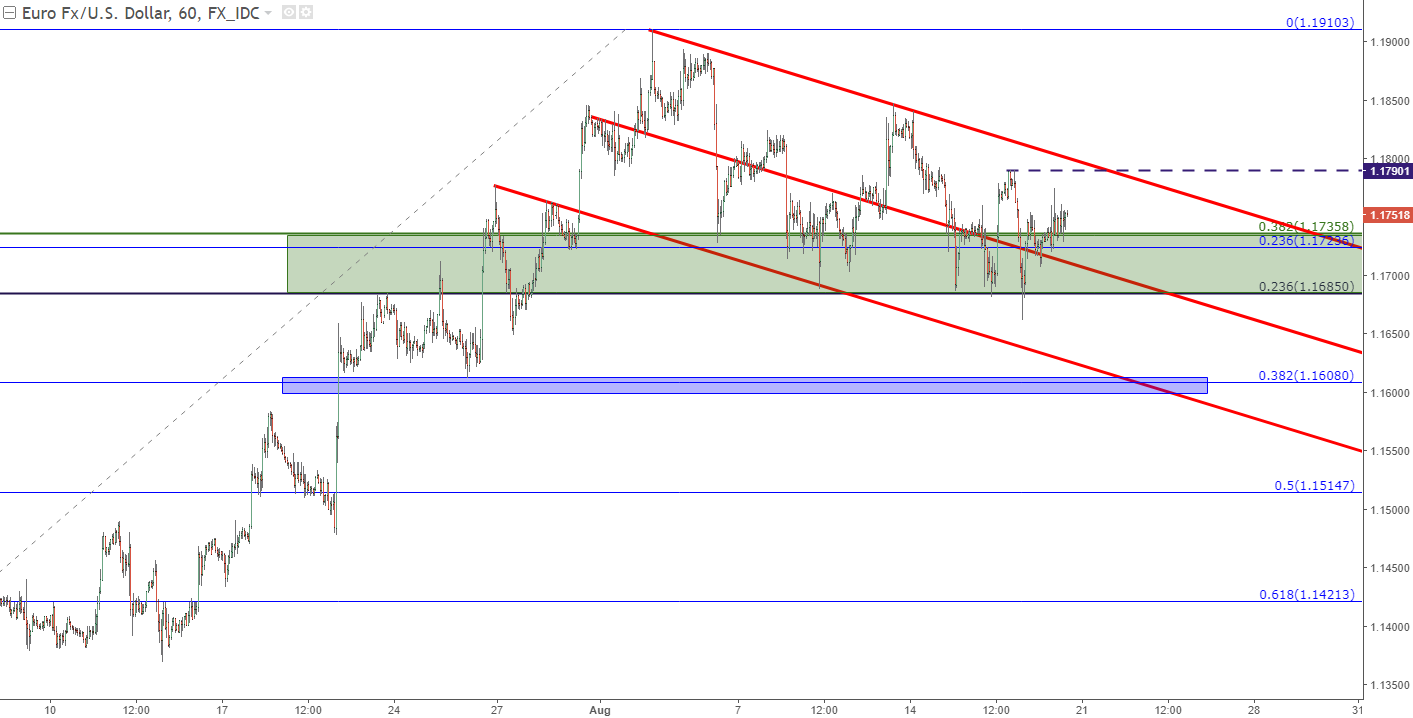
Chart prepared by James Stanley
GBP/USD for USD-Strength
The British Pound has been rather weak for most of August. This comes after another dovish outlay at the Bank of England was followed by a rather solid NFP report in the first week of the month. A continuation of soft data out of the U.K. helped to drive the pair lower, and at this point, we’re operating at a fairly interesting area of support on the chart.
We looked at this confluent support zone in the pair on Tuesday, as Cable had run-down to a projected trend-line that’s confluent with a Fibonacci level at 1.2848. What we wrote then still applies: A downside break of the prior swing-low at 1.2809 opens the door for short-side continuation in the pair. This would allow for traders to look to prior support, at the under-side of the trend-line and the Fib level at 1.2848, for resistance in setting up the short position.
GBP/USD Four-Hour: Cable Continues Testing Confluent Support
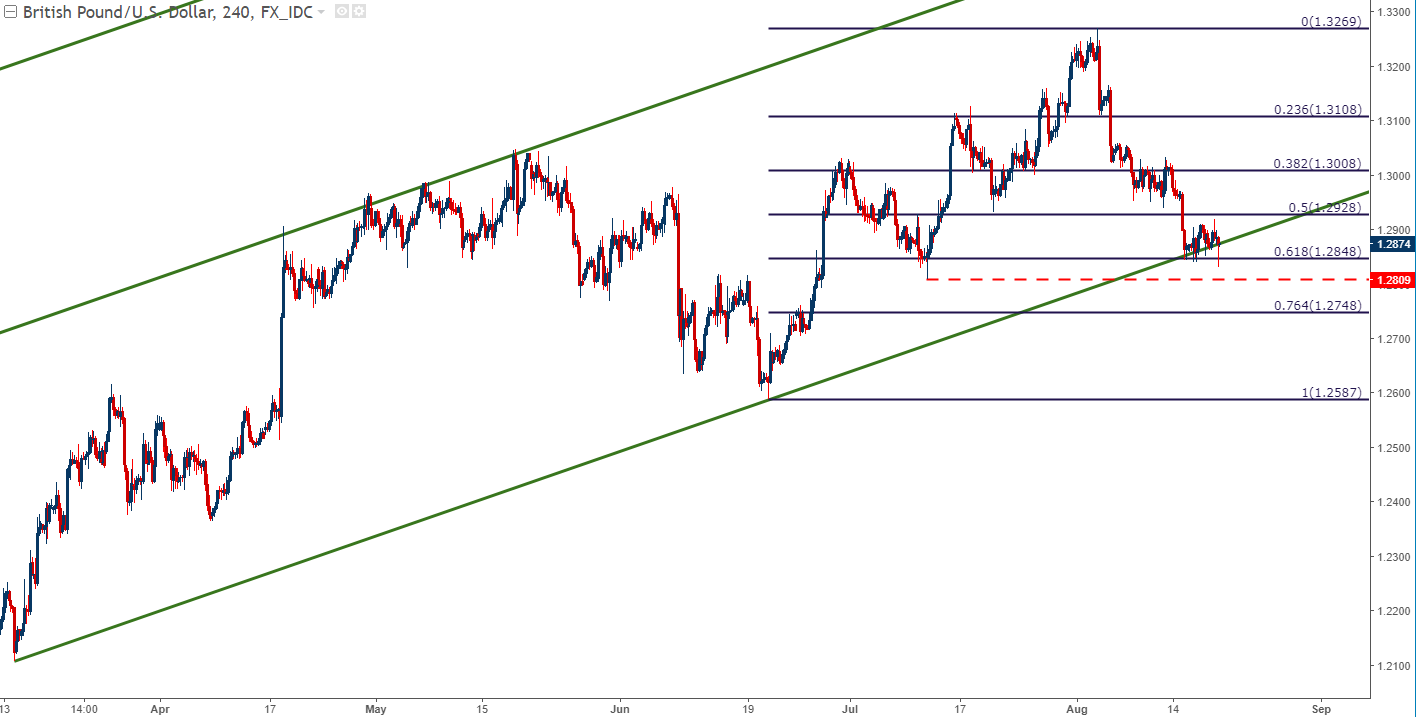
Chart prepared by James Stanley
--- Written by James Stanley, Strategist for DailyFX.com
To receive James Stanley’s analysis directly via email, please SIGN UP HERE
Contact and follow James on Twitter: @JStanleyFX


