To receive James Stanley’s Analysis directly via email, please sign up here.
Talking Points:
- The British Pound is clawing back from a fresh eight week low set just last week. Are we seeing a legitimate bullish reversal, or is price action in the process of making that next ‘lower high’? There are setups on both sides here, as we discuss below.
- IG Client Sentiment is currently +1.0715, as of this writing.
- Want to see how GBP/USD has held up to the DailyFX Q3 Forecasts? Click here for full access.
The British Pound has been on quite the rollercoaster so far in 2017. After coming into the year wrapped-up in Brexit worries, the pair began to show bullish tendencies as the prospect of rising inflation became more real. Inflation for the month of May perked all the way up to 2.8%, giving ammunition to bulls under the premise that the BoE might be forced away from their uber-dovish monetary stance. But after inflation came-in a bit tamer in June and July, those concerns began to recede into the background and when the Bank of England met earlier in the month of August, it appeared that those worries were ready to fade to black.
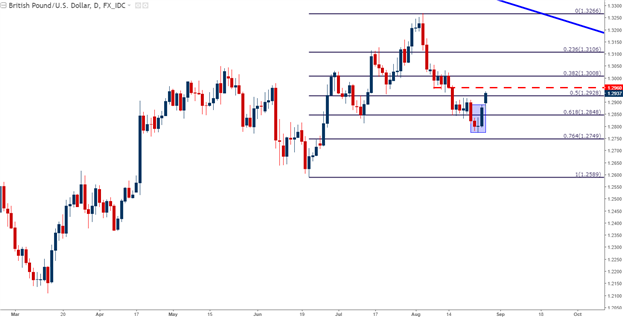
In our last article, we looked at the bearish move in GBP/USD after the pair had broken-below the 1.3000 level. The British Pound was rather strong coming into August, but after the Bank of England’s Super Thursday on the second trading day of the month saw the bank insert another dovish set of comments, the pair had been sliding-lower as we came into last week’s Jackson Hole Economic Symposium. As we neared the start of the event, GBP/USD moved-down to a fresh six-week-low at 1.2774. But as we heard from Chair Yellen and Mario Draghi on Friday, another gust of USD-weakness took over, and GBP/USD began to rally off of last week’s lows. This produced a morning star formation that, at least so far, has led to bullish continuation up to a key zone of resistance. The price of 1.2928 is the 50% Fibonacci retracement of the most recent bullish move, taking the June low up to the August high; and 1.2960 is a batch of swing-lows that had developed after the initial re-break below 1.3000.
GBP/USD Daily: Morning Star Formation Sets on Wednesday, Thursday and Friday

Chart prepared by James Stanley
From here, the door can be opened on either side of the trade. Given that last week led to a fresh low, traders can look for a ‘higher-low’ to form below the previous swing-high around 1.3008, or the 38.2% retracement, for a bearish continuation thesis.
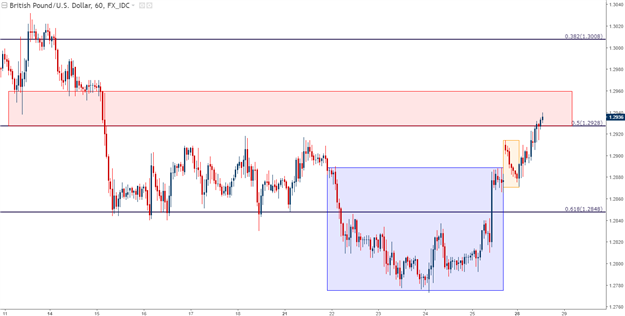
The long side of the setup would be a bit more new given that this low showed-up just last week, so traders may want to wait for a bit of confirmation before looking to press this side of the pair. But in the bullish side of the camp we have a cup and handle formation on the hourly chart that’s just seen a top-side breakout above the handle. This further exposes the 50% Fibonacci retracement at 1.2928, and for those looking to entertain a bullish posture, a sustained break above this level could make the bullish continuation thesis appear a lot more attractive. If prices are able to ascend above this area of resistance, traders can then look for support to show at this level for topside continuation. We had previously discussed how traders can utilize price action to confirm support or resistance around trend changes, and this is what traders would want to look for here if playing the bullish side of Cable.
GBP/USD Hourly: Fresh Two-Week Highs After Bullish Breakout from Cup (blue) & Handle (orange)

Chart prepared by James Stanley
--- Written by James Stanley, Strategist for DailyFX.com
To receive James Stanley’s analysis directly via email, please SIGN UP HERE
Contact and follow James on Twitter: @JStanleyFX


