


Gold Price Talking Points:
- Given recent technical observations about the gold price rally being overextended and facing exhaustion, the turn in sentiment around US-led trade wars is arriving at just the right time.
- Relaxation in tensions between the US and Mexico after the tariffs were avoided is helping provoke a rebound in risky assets - reducing gold's appeal as a safe haven.
- The pause in the gold rally has created the conditions for a pullback, per retail trader positioning.
Looking for longer-term forecasts on Gold and Silver prices? Check out the DailyFX Trading Guides.
A surprising turn of events after the close on Friday precipitated significant gaps in prices when markets opened this week, gold prices included. US President Donald Trump announcing that the Mexico tariffs would be “suspended indefinitely” after an agreement regarding immigration and the southern border was reached between the two countries.
The gains by US equities, US Treasury yields, and the US Dollar – in aggregate reflecting market participants’ collective belief that the odds of a sharp slowdown to the US economy and thus three rate cuts over the next year have dropped, per Fed funds futures – make for a difficult environment for gold prices at the start of the week.
Two Major Drivers of Gold Prices Taking a Breather
There have been two significant drivers of gold price action over the past month, with the former feeding into the latter: developments around US-led trade wars; and the ensuing speculation around the timing of Fed rate cuts. With the US-China trade war intensifying over the course of May, culminating in the imposition of tariffs at the start of June, gold prices saw their role as a safe haven renewed.
And with the threat of tariffs on Mexico arriving in the second half of the month, all of the sudden there was a tangible possibility of a dramatic slowdown in the US economy: estimates suggest that the combined effect of the China, Mexico, and global auto tariffs would have knocked off over 1% from US GDP this year alone.
Calendar and Event Risk Create Environment for Gold Rally Pause
With the prospect of a sharp slowdown hitting the US economy, traders have been aggressively pricing in a more dovish Federal Reserve over the next year. Federal Reserve policymakers, including Fed Chair Jerome Powell, have been offering up commentary that has reinforced the market’s collective belief. The resulting drop in US Treasury yields (and US real yields) proved to make for one of the more bullish fundamental backdrops for gold prices in quite some time.
Yet with the Federal Reserve in its blackout period before the June Fed meeting, a bullish catalyst for gold prices has been removed this week: policymakers talking up the possibility of rate cuts.
Additionally, now that the Mexico tariff threat has been lifted, another bullish catalyst that helped drive gold prices higher in recent weeks has been eliminated. In turn, the odds of the Federal Reserve feeling the need to take immediate dovish policy action has been reduced; whereas last week Eurodollar contracts (interest rate contracts between commercial banks) were pricing out 73-bps over the next year, they are only pricing out 65-bps today. This means that market participants are thinking the Fed will be less dovish moving forward, a mindset that doesn’t cater to a bullish outlook for gold prices.
Gold Volatility Drop Drags Down Gold Prices
It bears mentioning again that one of the more important factor of the recent gold price rally has been how gold volatility moved higher alongside prices. Whereas other asset classes don’t like increased volatility (signaling greater uncertainty around cash flows, dividends, coupon payments, etc.), precious metals tend to benefit from periods of higher volatility as uncertainty increases the appeal of gold’s and silver’s safe haven appeal.
GVZ (Gold Volatility) Technical Analysis: Daily Price Chart (June 2018 to June 2019) (Chart 1)
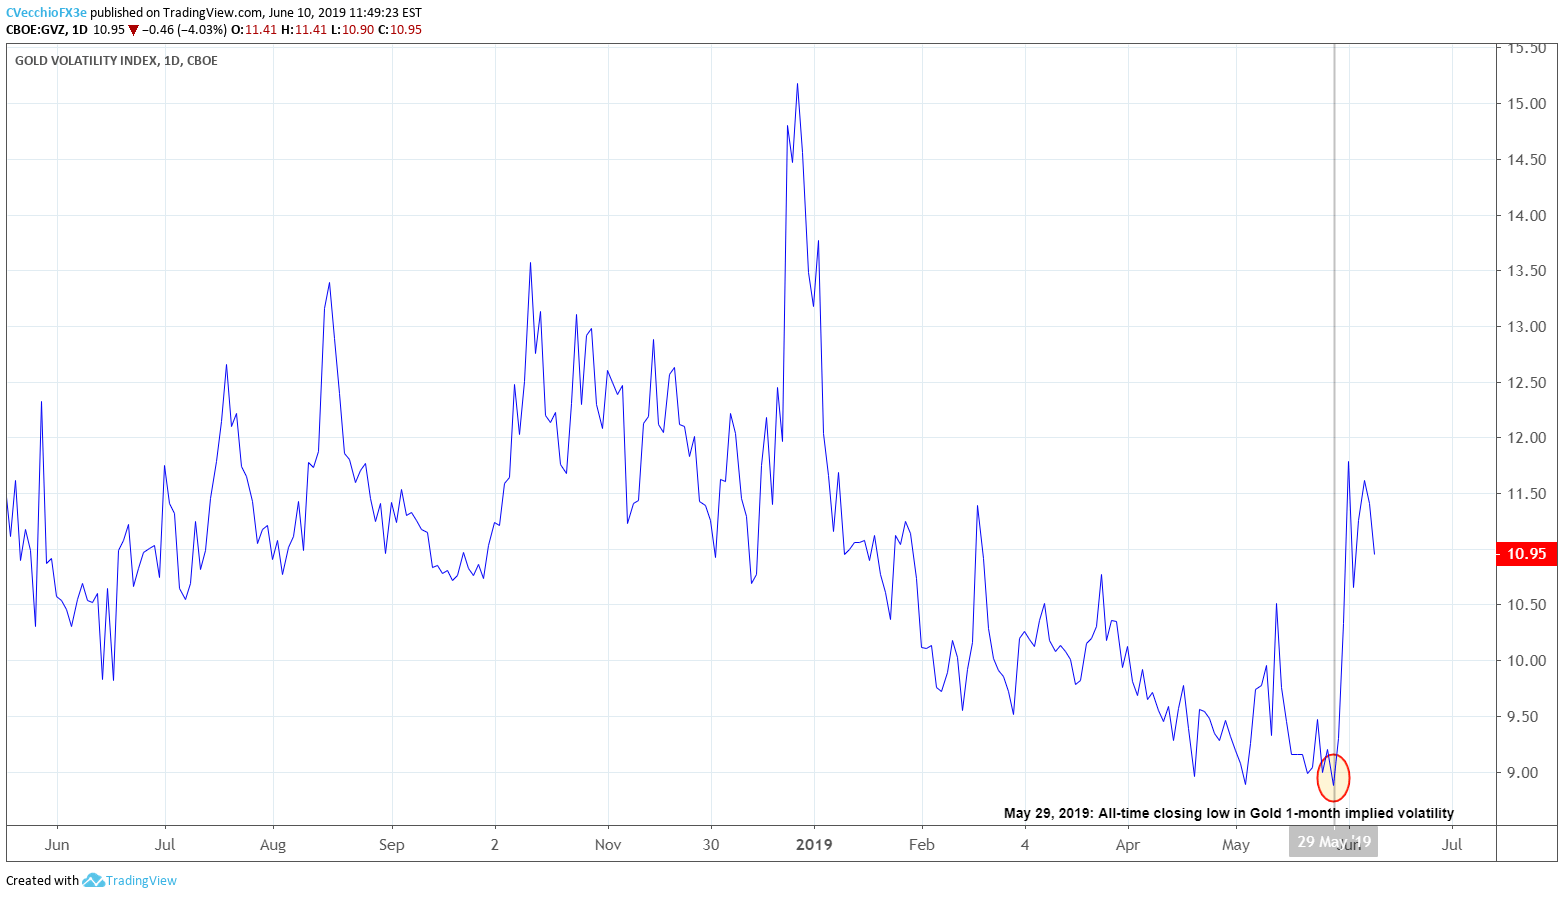
That gold volatility (as measured by the CBOE’s gold volatility ETF, GVZ, which tracks the 1-month implied volatility of gold as derived from the GLD option chain) has started to pullback suggests that gold prices are facing a more difficult environment in the near-term.
Gold Price Pullback Was Due – Corrective Price Action is Here
Last week we examined episodes since August 2018 when gold prices were more than 2% above their daily 21-EMA, positing that this was a sign that the gold price rally was nearing exhaustion.
Four instances occurred since the gold price bottoming effort began in Q3’18, producing an average 1-week return of -0.49%: October 3, 2018 (0.12%); January 3, 2019 (-0.59%); January 31, 2019 (-0.59%); and February 19, 2019 (-0.90%). A fifth instance had occurred last Wednesday, when gold prices moved more than 2% above their daily 21-EMA. At the time we suggested that “the risk for exhaustion setting in again soon and cutting the rally short is increasing.”
Then on Friday, after gold prices returned to the base of the bullish falling wedge, it was noted that “traders should be cautioned the fulfilment of this pattern may mean that the gold price rally is due for a breather…the current technical environment for gold prices is similar to other times when rallies were cut short.”
Since hitting a high of 1348.13 last Wednesday, gold prices have come down -1.3% to where they stood at 1327.23 at the time this note was written.
Gold Price Technical Analysis: Daily Chart (April 2018 to June 2019) (Chart 2)
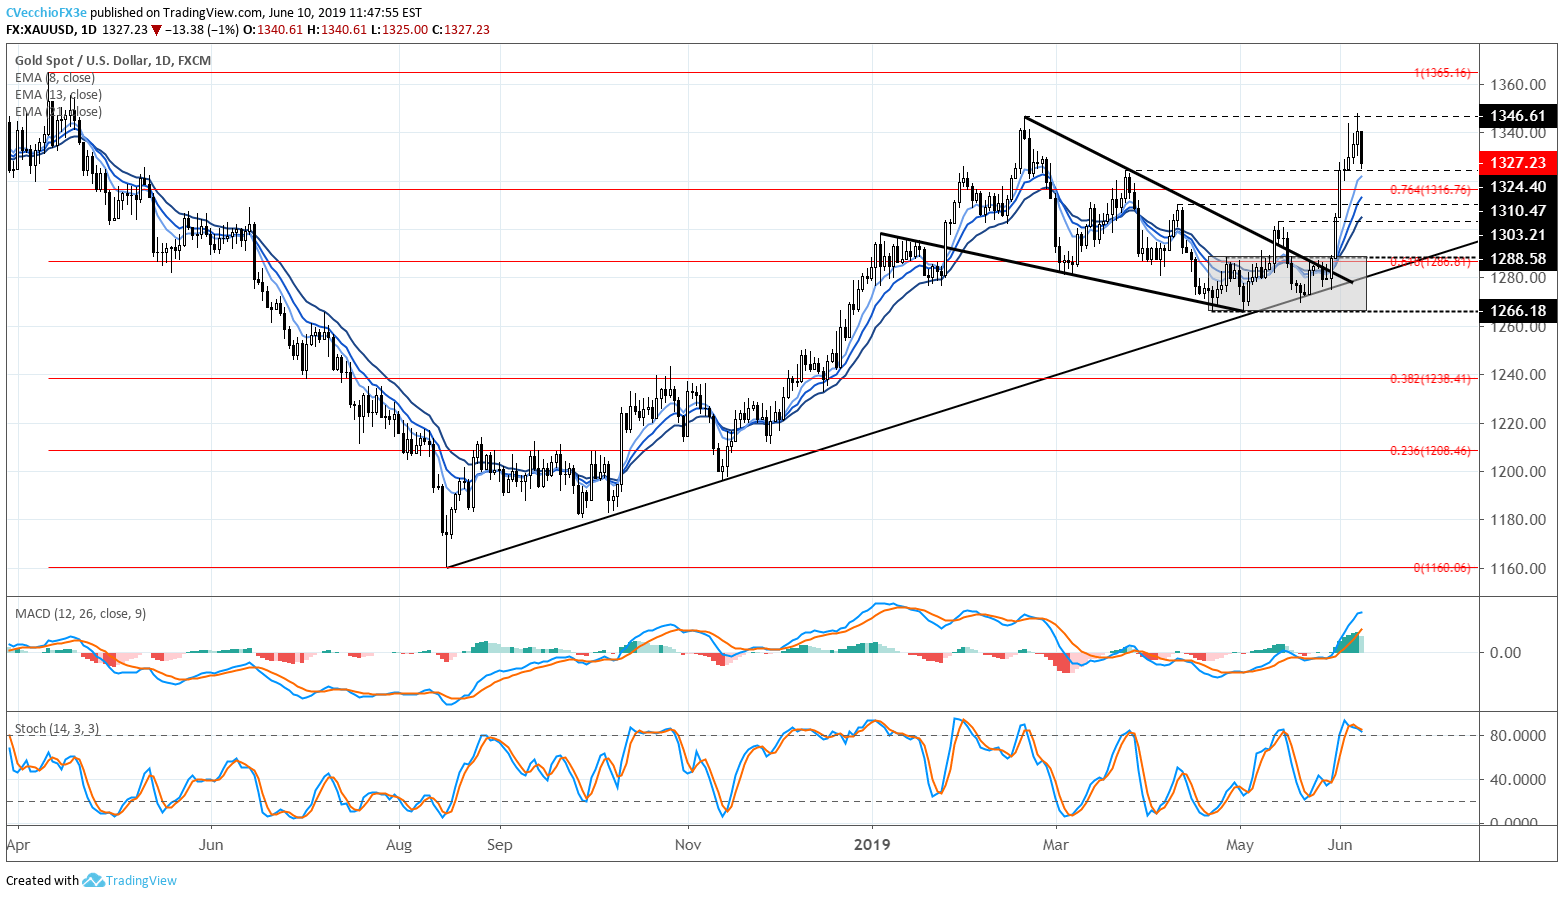
If this is indeed another episode where the gold price move in excess of 2% of the daily 21-EMA signaled near-term exhaustion, then the pullback in gold prices may simply be a healthy correction in context of a longer-term uptrend. The fulfillment of the bullish falling wedge pattern in gold prices only underscores the rationale that the recent gold price rally is due for a pause (just like at the end of January 2019, for example).
Given that trading is both a function of price and time, the correction could simply mean that gold prices trade sideways as the moving averages catch up and the overbought condition of gold prices being too far extended above the daily 21-EMA is worked off. The former resistance now support appearing as the March 25 swing high at 1324.40 may be the first near-term support level followed by the daily 8-EMA at 1322.07; a break below this area (1322.07/1324.40) would a sign that a deeper pullback is due for gold prices.
IG Client Sentiment Index: Spot Gold Price Forecast (June 10, 2019) (Chart 3)

Spot gold: Retail trader data shows 56.7% of traders are net-long with the ratio of traders long to short at 1.31 to 1. The number of traders net-long is 6.8% higher than yesterday and 21.9% lower from last week, while the number of traders net-short is 8.5% lower than yesterday and 43.7% higher from last week.
We typically take a contrarian view to crowd sentiment, and the fact traders are net-long suggests spot gold prices may continue to fall. Traders are further net-long than yesterday and last week, and the combination of current sentiment and recent changes gives us a stronger spot gold-bearish contrarian trading bias.
FX TRADING RESOURCES
Whether you are a new or experienced trader, DailyFX has multiple resources available to help you: an indicator for monitoring trader sentiment; quarterly trading forecasts; analytical and educational webinars held daily; trading guides to help you improve trading performance, and even one for those who are new to FX trading.
--- Written by Christopher Vecchio, CFA, Senior Currency Strategist
To contact Christopher Vecchio, e-mail at cvecchio@dailyfx.com
Follow him on Twitter at @CVecchioFX
View our long-term forecasts with the DailyFX Trading Guides


