


- Gold price rally testing resistance at 2014 highs- trade remains constructive above 1327
- Check out our 2019 projections in our Free DailyFX Gold Trading Forecasts
- Join Michael for Live Weekly Strategy Webinars on Mondays at 12:30GMT
Gold prices are up more than 4.1% this week and for a fifth consecutive weekly advance in XAU/USD. The rally marks the largest single-week advance since April of 2016 with price now probing a key resistance zone at fresh five-year highs. These are the updated targets and invalidation levels that matter on the XAU/USD weekly price chart. Review my latestWeekly Strategy Webinar for an in-depth breakdown of this setup and more.
New to Gold Trading? Get started with this Free How to Trade Gold -Beginners Guide
Gold Price Chart - XAU/USD Weekly

Notes: In my last Gold Price Outlook we noted that the, “The weekly opening-range is set in Gold heading into the FOMC interest rate decision later today – look for the break…. A topside breach keeps the focus on subsequent resistance objectives at the 2016 high-week close at 1366 and the 38.2% retracement / 2014 high at 1380/92 (critical).” A breakout post-Fed led the advance with the rally taking XAU/USD to fresh multi-year highs (high registered at 1411). The focus is on a weekly close heading into Friday with price now testing key resistance at 1380/92 – note that basic parallel / channel resistance converges on this zone and further highlights its technical significance.
A close above this threshold keeps the focus on subsequent topside objectives at 1433 and the 100% extension of the late-2015 advance at 1451- look for a bigger reaction there IF reached. Interim support now 1366 backed by the 2018 high-week close at 1350. Broader bearish invalidation now raised to the February high-week close at 1327.
For a complete breakdown of Michael’s trading strategy, review his Foundations of Technical Analysis series on Building a Trading Strategy
Bottom line: The immediate focus is on a weekly close above this critical resistance zone at multi-year highs. A close above 1392 would keep the immediate long-bias viable heading into the final week of June trade. Failure here would highlight the risk for near-term exhaustion. From a trading standpoint, a good place to reduce long-exposure / raise protective stop. Ultimately, a pullback would offer more favorable entries closer to the former 2016 trendline. I’ll publish an updated Gold Price Outlook once we get further clarity in near-term price action next week. Review our latest Gold 2Q forecasts for a longer-term look at the technical picture for XAU/USD prices.
Even the most seasoned traders need a reminder every now and then- Avoid these Mistakes in your trading
Gold Trader Sentiment (XAU/USD)
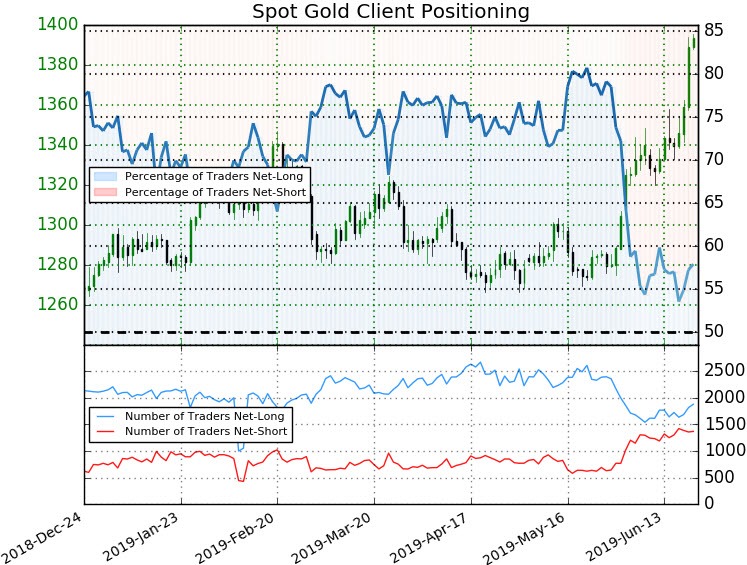
- A summary of IG Client Sentiment shows traders are net-long Gold - the ratio stands at +1.37 (57.8% of traders are long) – weak bearish reading
- Long positions are 11.5% higher than yesterday and 6.3% higher from last week
- Short positions are 1.3% lower than yesterday and 3.6% higher from last week
- We typically take a contrarian view to crowd sentiment, and the fact traders are net-long suggests Gold prices may continue to fall. Traders are further net-long than yesterday & last week, and the combination of current positioning and recent changes gives us a stronger Gold price (XAU/USD) -bearish contrarian trading bias from a sentiment standpoint.
See how shifts in Gold retail positioning are impacting trend- Learn more about sentiment!
---
Previous Weekly Technical Charts
- Kiwi (NZD/USD)
- Crude Oil (WTI)
- Japanese Yen (USD/JPY)
- Aussie (AUD/USD)
- Euro (EUR/USD)
- Swissy (USD/CHF)
- US Dollar (DXY)
Learn how to Trade with Confidence in our Free Trading Guide
--- Written by Michael Boutros, Technical Currency Strategist with DailyFX
Follow Michael on Twitter @MBForex


