


- Weekly technicals on Crude Oil prices (WTI)- testing support, broader risk lower sub-56.69
- Check out our 2019 projections in our Free DailyFX Crude Oil Trading Forecasts
- Join Michael for Live Weekly Strategy Webinars on Mondays at 12:30GMT
In this series we scale-back and look at the broader technical picture to gain a bit more perspective on where we are in trend. Crude Oil is setting a clean monthly opening-range just above key Fibonacci support at six-month lows. While the broader outlook remains weighted to the downside, the decline may be vulnerable here near-term and we’re on the lookout for possible exhaustion. Review my latest Weekly Strategy Webinar for an in-depth breakdown of this setup and more.
New to Oil Trading? Get started with this Free How to Trade Crude Oil Beginners Guide
Crude Oil Price Chart - WTI Weekly

Notes: In my last Crude Weekly Price Outlook we noted that, “A break below the monthly range lows / confluence support leaves the risk lower heading into the close of the May trade.” – Three weeks later and oil prices have plummeted more than 25% from the yearly highs with crude testing the median-line of the descending pitchfork formation extending off the 2018 / 2019 highs.
A weekly close below the 61.8% retracement of the December advance at 51.60 is needed to fuel the next leg lower targeting the weekly reversal close / slope confluence at ~ 48.24. Interim resistance stands at 55.21 backed by 56.69 - Ultimately a breach above the highlighted confluence zone at 60.06/47 would be needed to mark resumption of the broader uptrend.
For a complete breakdown of Michael’s trading strategy, review his Foundations of Technical Analysis series on Building a Trading Strategy
Bottom line: The crude breakdown has taken oil prices into secondary support targets here and leaves the immediate short-bias at risk near-term while above 51.60. From a trading standpoint, a good spot to reduce short-exposure / be on the lookout for possible exhaustion. Look for failure ahead of 56.70 IF prices are indeed heading lower on this stretch.Review my Top 2019 Trading Opportunities for a look at the longer-term Crude Oil outlook.
Even the most seasoned traders need a reminder every now and then- Avoid these Mistakes in your trading
Crude Oil Trader Sentiment
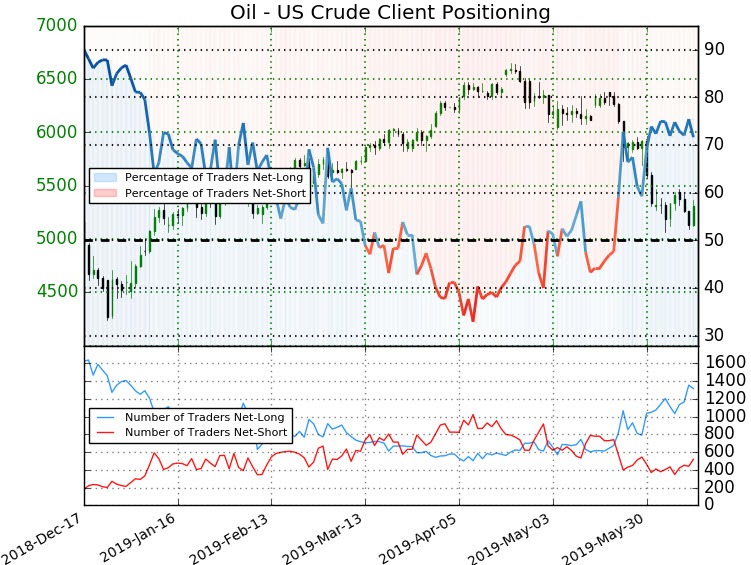
- A summary of IG Client Sentiment shows traders are net-long Crude Oil- the ratio stands at +2.53 (71.7% of traders are long) – bearishreading
- Traders have remained net-long since May 22nd; price has moved 15.3% lower since then
- Long positions are6.2% higher than yesterday and 2.7% higher from last week
- Short positions are4.8% higher than yesterday and 22.4% higher from last week
- We typically take a contrarian view to crowd sentiment, and the fact traders are net-long suggests Crude Oil prices may continue to fall. Traders are further net-long than yesterday & last week, and the combination of current positioning and recent changes gives us a stronger Crude Oil-bearish contrarian trading bias from a sentiment standpoint.
See how shifts in Crude Oil retail positioning are impacting trend- Learn more about sentiment!
---
Previous Weekly Technical Charts
- Japanese Yen (USD/JPY)
- Aussie (AUD/USD)
- Euro (EUR/USD)
- Swissy (USD/CHF)
- US Dollar (DXY)
- Gold (XAU/USD)
- Kiwi (NZD/USD)
Learn how to Trade with Confidence in our Free Trading Guide
--- Written by Michael Boutros, Technical Currency Strategist with DailyFX
Follow Michael on Twitter @MBForex


