


- Crude Oil down more than 11% off the yearly highs- price approaching initial support targets
- Check out our 2019 projections in our Free DailyFX Crude Oil Trading Forecasts
- Join Michael for Live Weekly Strategy Webinars on Mondays at 12:30GMT
Crude Oil prices have plummeted more than 8% from the monthly highs registered last week with the decline now approaching initial support targets- we’re looking for a reaction off one of these levels for guidance. Here are the updated targets and invalidation levels that matter on the Crude Oil (WTI) charts heading into the close of the week. Review my latest Weekly Strategy Webinar for an in-depth breakdown of this setup and more.
New to Oil Trading? Get started with this Free How to Trade Crude Oil Beginners Guide
Oil Daily Price Chart (WTI)
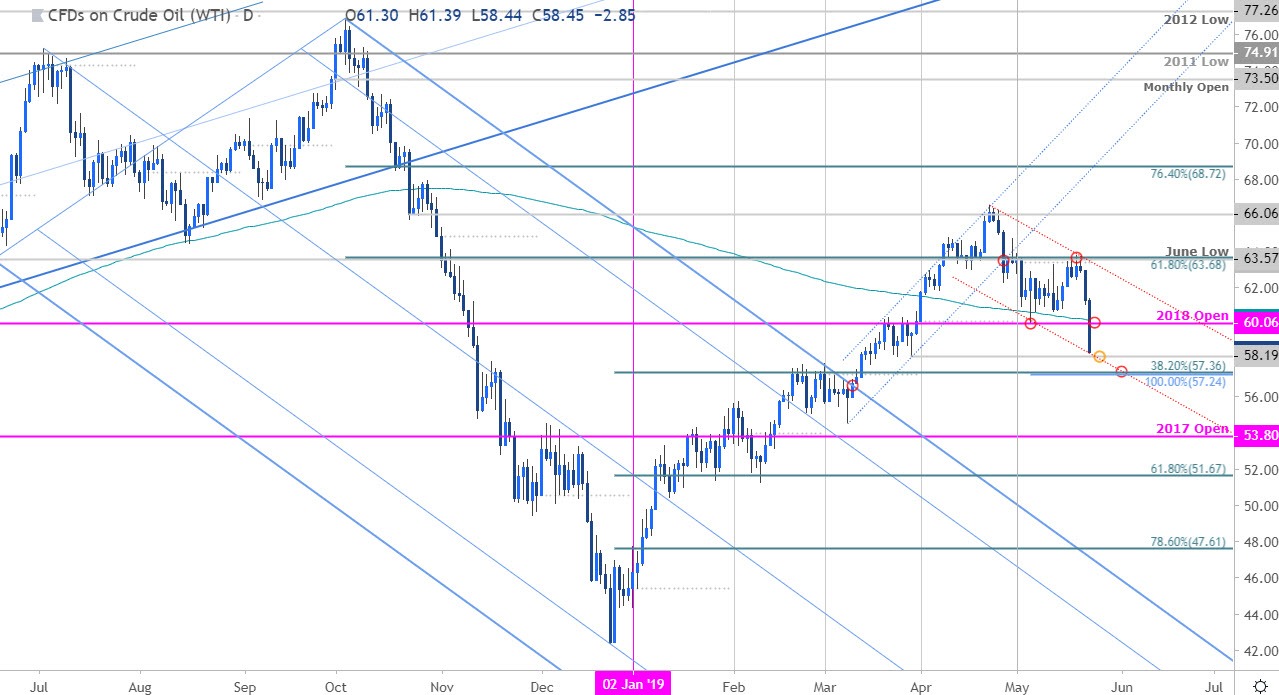
Technical Outlook: In my last Oil Price Outlook we noted that the immediate decline was at risk as Crude was approaching a key support zone, “at 60.06- a break / close below this threshold is needed to suggest a more significant high is place.” A sharp reversal early in the month fueled a rally back into confluence resistance at 63.43/68 - a turn off this zone this week is now breaking below the 200-day moving average, the 2018 open and the monthly opening-range lows at 60.06/22 – the risks remains for further losses for oil prices while below this threshold.
Immediate downside targets are quickly approaching at the late-March low at 58.19 and a more significant support confluence at 57.24/36- a region defined by the 100% extension of the April decline and the 38.2% retracement of the December advance. Look for a bigger reaction there IF reached with a weekly close below needed to keep the immediate short-bias viable targeting 55.53. Daily resistance now stands back at 60.06/22.
Why does the average trader lose? Avoid these Mistakes in your trading
Oil 120min Price Chart (WTI)

Notes: A closer look at price action shows oil trading within the confines of a near-term descending pitchfork formation extending off the recent highs with a clear break of the weekly opening-range yesterday sparking the decline. A break below the 60.06/22 saw price accelerate lower with the sell-off now targeting initial support objects at the lower parallels. The focus is lower wile below the median-line with bearish invalidation set to highlighted slope confluence around 61.65.
Learn how to Trade with Confidence in our Free Trading Guide
Bottom line: Crude prices are approaching key support objectives that could interrupt the current sell-off. From a trading standpoint, look to reduce short-exposure / lower protective stops on a move towards the lower targets and be on the lookout for possible price exhaustion heading into the lower parallels. Ultimately, I’ll favor fading strength sub-60 with a break / close below 57.24needed to fuel the next leg lower. Review my Top 2019 Trading Opportunities for a look at the longer-term Crude Oil outlook.
For a complete breakdown of Michael’s trading strategy, review his Foundations of Technical Analysis series on Building a Trading Strategy
Crude Oil Trader Sentiment

- A summary of IG Client Sentiment shows traders are net-long Crude Oil- the ratio stands at +1.41 (58.5% of traders are long) – weak bearishreading
- Long positions are12.9% higher than yesterday and 30.4% higher from last week
- Short positions are22.5% lower than yesterday and 30.5% lower from last week
- We typically take a contrarian view to crowd sentiment, and the fact traders are net-long suggests Crude Oil prices may continue to fall. Traders are further net-long than yesterday & last week, and the combination of current positioning and recent changes gives us a stronger Crude Oil-bearish contrarian trading bias from a sentiment standpoint.
See how shifts in Crude Oil retail positioning are impacting trend- Learn more about sentiment!
---
Active Trade Setups
- Aussie Price Outlook: Australian Dollar in Search of Support
- Canadian Dollar Price Outlook: USD/CAD at Weekly High as Loonie Dives
- Gold Price Outlook: XAU Testing Yearly Lows – Shorts Vulnerable
- Sterling Price Outlook: GBP/USD Bulls Buckle Up for Fed, BoE, NFP
- Euro Price Outlook: EUR/USD Snap Back- Trade or Fade?
- Written by Michael Boutros, Currency Strategist with DailyFX
Follow Michael on Twitter @MBForex


