


- Gold prices in consolidation below 2016 slope resistance into FOMC – levels to know
- Check out our 2019 projections in our Free DailyFX Gold Trading Forecasts
- Join Michael for Live Weekly Strategy Webinars on Mondays at 12:30GMT
Gold prices are trading just 1% off the yearly highs heading into today’s FOMC interest rate decision today. While the broader outlook remains constructive, the immediate advance may be vulnerable here below multi-year slope resistance with a well-defined weekly opening-range taking shape. These are the updated targets and invalidation levels that matter on the XAU/USD charts this week. Review this week’s Strategy Webinar for an in-depth breakdown of this Gold setup and more.
New to Gold Trading? Get started with this Free How to Trade Gold -Beginners Guide
Gold Price Chart - XAU/USD Daily
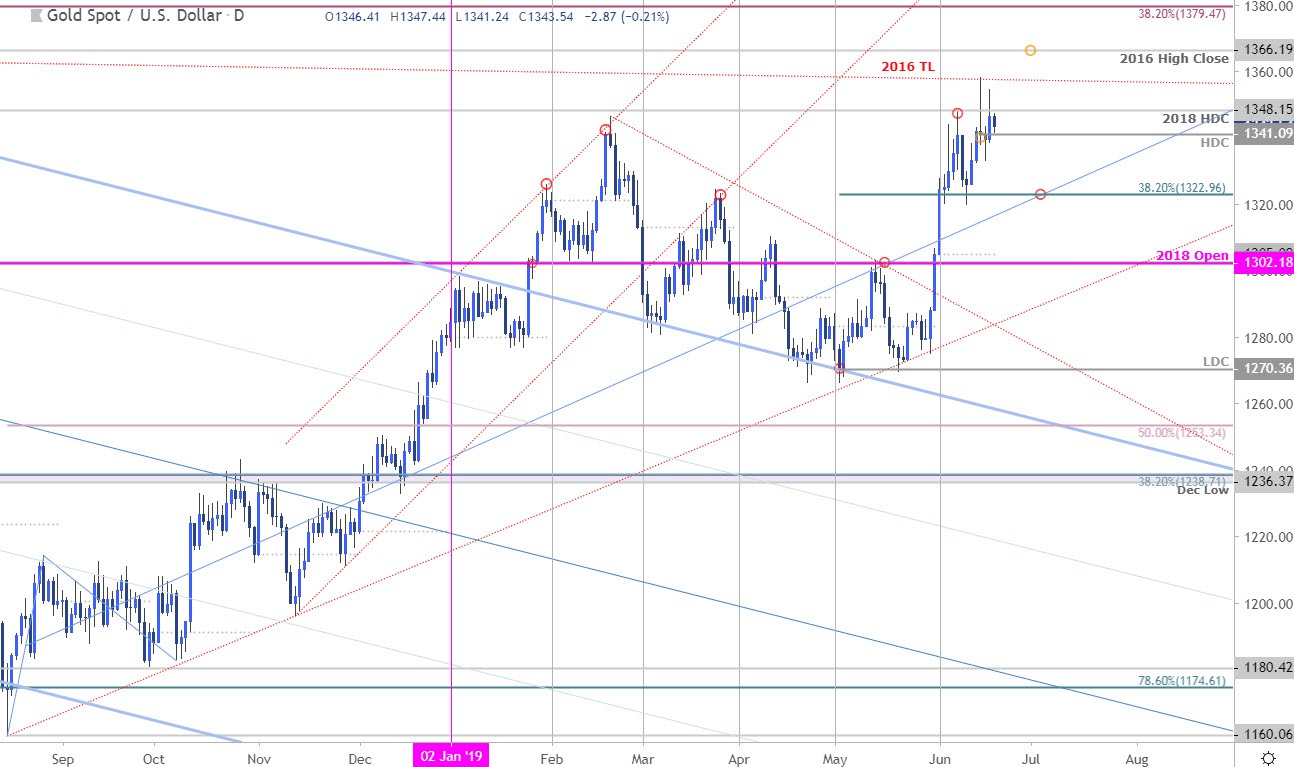
Technical Outlook: In my latest Gold Price Weekly Outlook we noted that the breakout was testing the 2016 trendline with the, “immediate gold price advance is vulnerable while below this slope – risk for exhaustion IF price fails a weekly close above 1351.” XAU/USD closed at 1341 last week (also the high-day close) with price consolidating around the 2018 high-day close at 1348.
Momentum divergence into this high continues to highlight the risk for near-term exhaustion here with initial daily support eyed at the 38.2% retracement of the May advance at 1323. Broader bullish invalidation rests with the monthly open / opening-range low / 2018 open at 1302/05. A topside breach exposes subsequent resistance objectives at the 2016 high-close at 1366 and the 38.2% retracement at 1379.
Why does the average trader lose? Avoid these Mistakes in your trading
Gold Price Chart - XAU/USD 240min
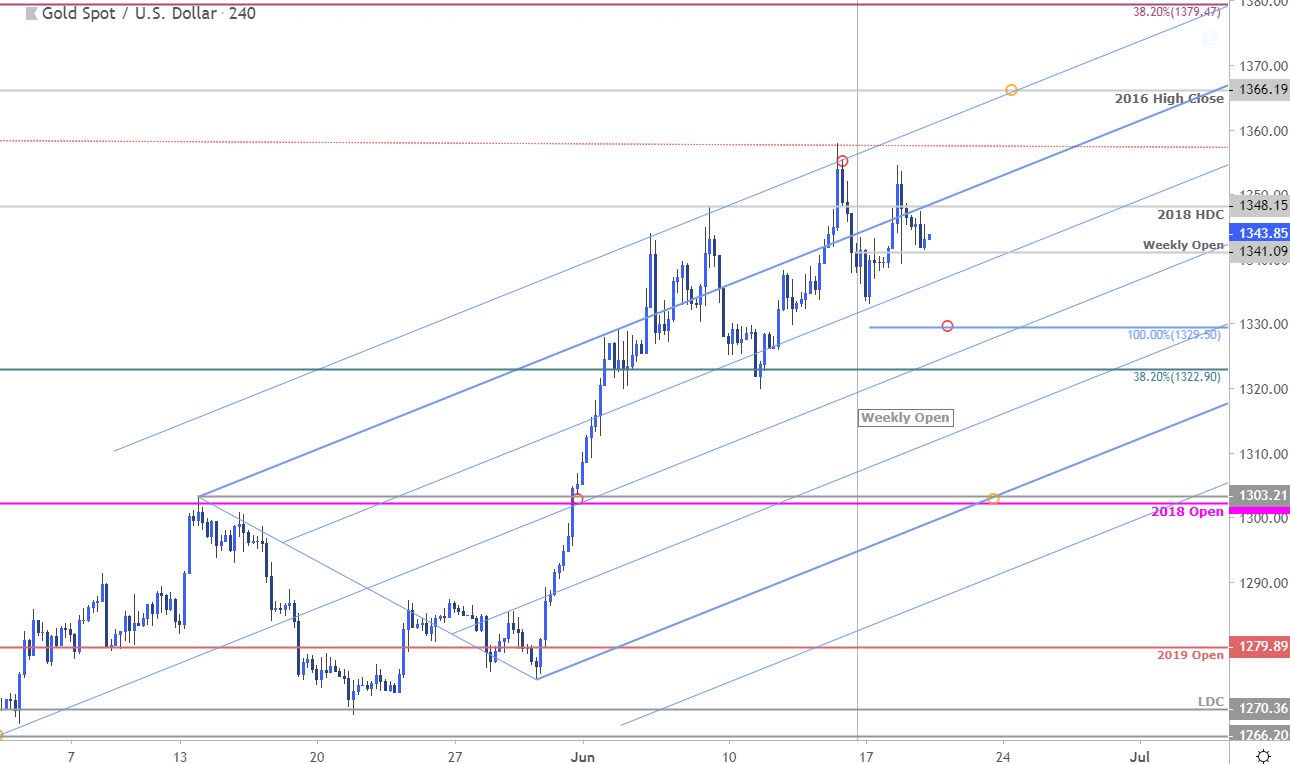
Notes: A closer look at price action shows Gold trading within the confines of an ascending pitchfork formation extending off the May lows with price responding to the upper parallels late-last week. IF Friday’s pullback is corrective, losses should be limited to 1329 with near-term bullish invalidation at 1323 – both areas of interest for possible downside exhaustion if reached.
Learn how to Trade with Confidence in our Free Trading Guide
Bottom line: The weekly opening-range is set in Gold heading into the FOMC interest rate decision later today – look for the break. While the broader outlook remains constructive, a downside break could trigger a larger correction – ultimately, we’d be looking for more favorable entries on a larger pullback. From a trading standpoint, a good spot to reduce long-exposure / raise protective stops – be on the lookout for a washout lower. A topside breach / close above of the 2016 trendline is needed to mark resumption. Review our latest Gold 2Q forecasts for a longer-term look at the technical picture for XAU/USD prices.
For a complete breakdown of Michael’s trading strategy, review his Foundations of Technical Analysis series on Building a Trading Strategy
Gold Trader Sentiment

- A summary of IG Client Sentiment shows traders are net-long Gold- the ratio stands at +1.24 (55.5% of traders are long) – weak bearishreading
- Long positions are1.4% lower than yesterday and 0.9% lower from last week
- Short positions are5.8% higher than yesterday and 27.1% higher from last week
- We typically take a contrarian view to crowd sentiment, and the fact traders are net-long suggests Gold prices may continue to fall. Yet traders are less net-long than yesterday & compared with last week and the recent changes in sentiment warn that the current Gold price trend may soon reverse higher despite the fact traders remain net-long.
See how shifts in Gold retail positioning are impacting trend- Learn more about sentiment!
---
Active Trade Setups
- Kiwi Price Outlook: New Zealand Dollar Counter-Offensive, First Test
- Canadian Dollar Price Outlook: USD/CAD Recovery Eyes Trend Resistance
- Euro Price Outlook: EUR/USD Breakout Stalls – Trade Levels to Know
- Written by Michael Boutros, Currency Strategist with DailyFX
Follow Michael on Twitter @MBForex


