


- A look at the weekly technicals on DXY, USD/JPY, NZD/USD & Bitcoin
- Review the Foundations of Technical Analysis mini-series
- Join Michael for Live Weekly Strategy Webinars on Mondays at 12:30GMT
In this series we scale-back and take a look at the broader technical picture to gain a bit more perspective on where we are in trend. Here are the key levels that matter heading into the open of February trade. Review this week’s Strategy Webinar for an in-depth breakdown of these setups and more.
AUD/USD Weekly Price Chart
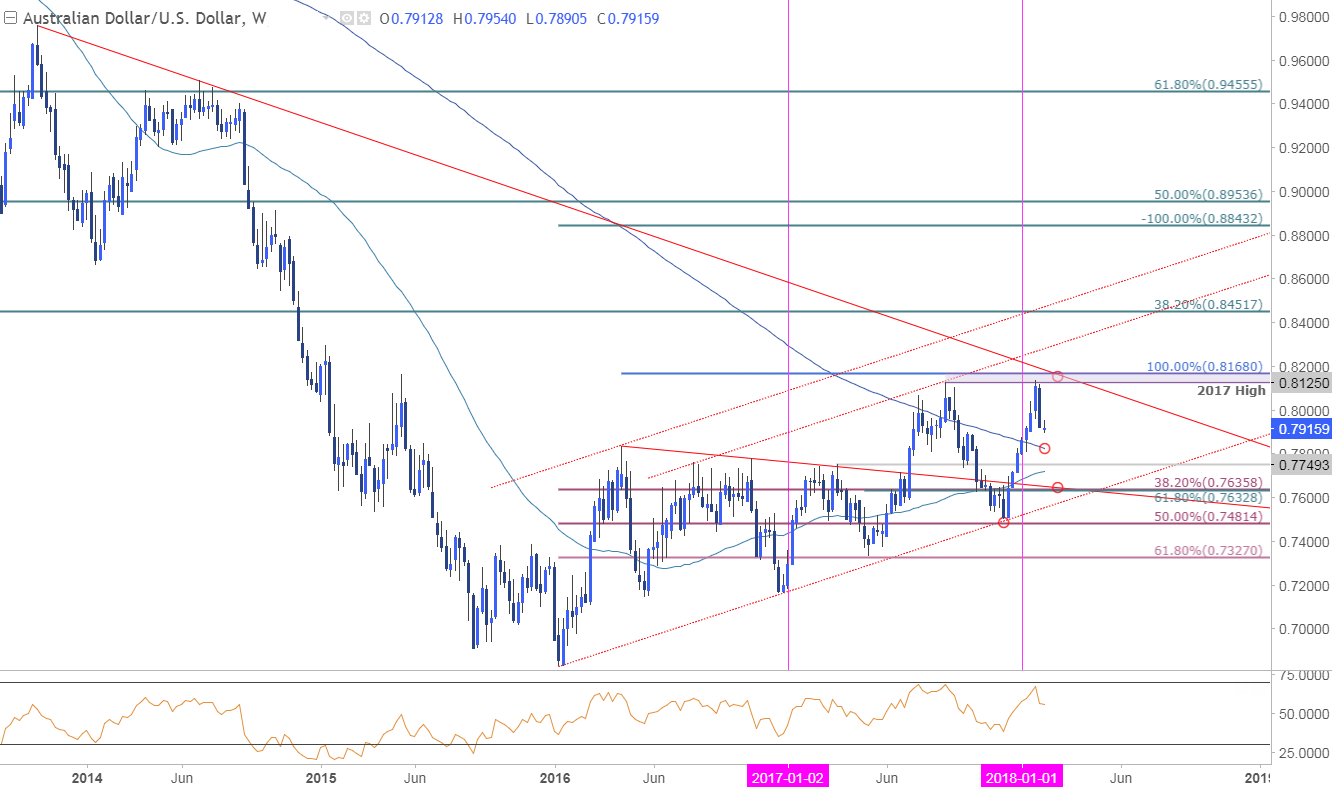
Notes: Last week we highlighted that the rally in Aussie was vulnerable as price struggled around the 2017 highs at 8125. The reversal of resistance snaps a seven-week advance in price – the last few instances saw an interruption (If not a larger correction) before resumption of the broader trend. Interim support seen at the yearly open / 200-week moving average at ~7800/20s backed by 7720/49. Broader bullish invalidation now raised to the 7632/35 confluence support range.
Bottom Line: Expect sideways-to-higher price action with the long-bias still at risk sub-8125/68. From a trading standpoint, I’ll favor selling rallies for now with a break lower to ultimately offer favorable long-entries near the aforementioned support targets.
New to ForexTrading? Get started with this Free Beginners Guide
USD/CAD Weekly Price Chart
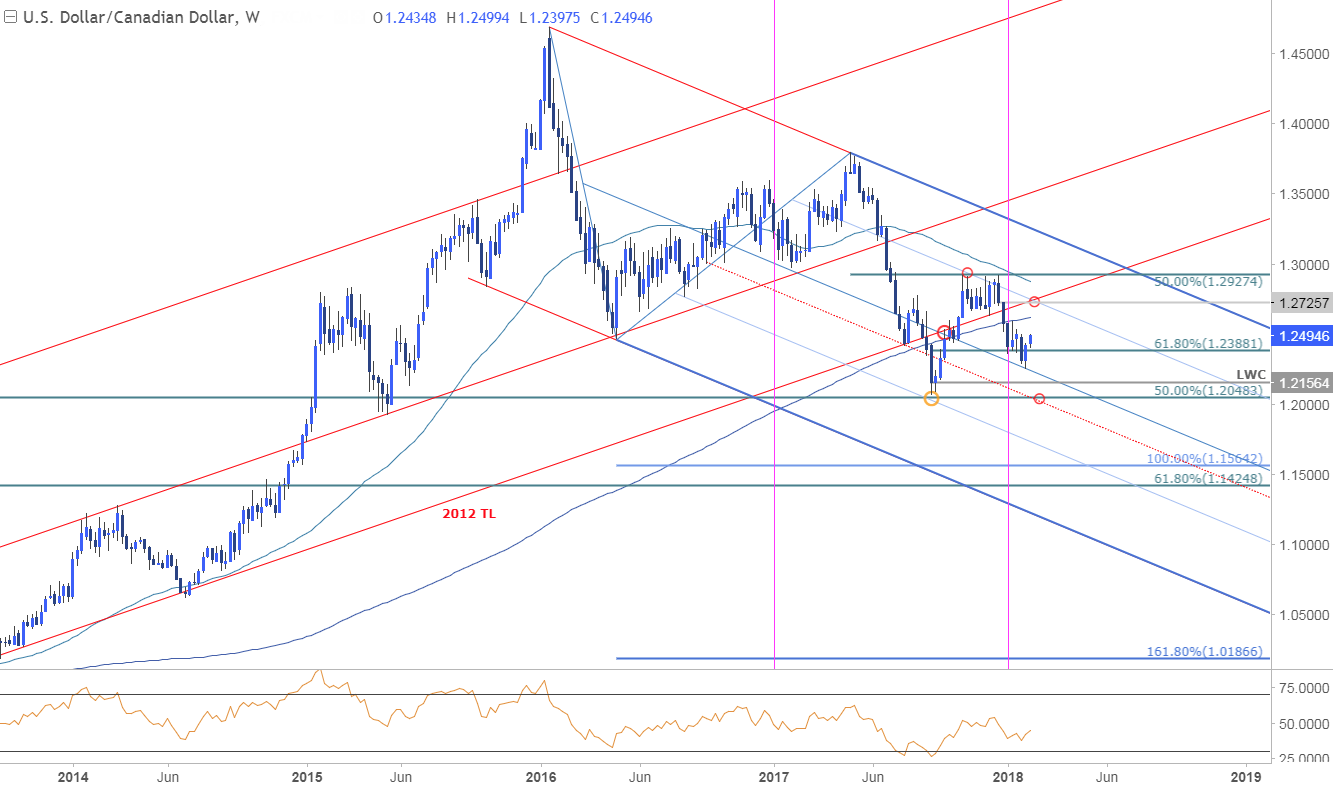
Notes: USD/CAD reversed precisely off median-line support last week with price closing back above the 1.24-handle. The rebound may have further legs near-term but ultimately we’re looking for exhaustion in price on a rally towards the 200-week moving average at 1.2620s and confluence resistance into the December high-week reversal close at 1.2726 (bearish invalidation).
Bottom line:Looking for this rebound to offer more favorable short-entries near structural resistance with a break lower targeting subsequent support targets at the 2017 low-week close at 1.2156 and the 50% retracement at 1.2048.
Why does the average trader lose? Avoid these Mistakes in your trading
USD/CAD IG Client Positioning

- A summary of IG Client Sentiment shows traders are net-long USD/CAD- the ratio stands at +2.06 (67.3% of traders are long) – bearishreading
- Retail has remained net-long since Jan 25th; price has moved 1.1% higher since then
- Long positions are 3.9% higher than yesterday and 9.1% lower from last week
- Short positions are 8.0% lower than yesterday and 33.1% lower from last week
- We typically take a contrarian view to crowd sentiment, and the fact traders are net-long suggests USDCAD prices may continue to fall. Traders are further net-long than yesterday and last week, and the combination of current positioning and recent changes gives us a stronger USDCAD-bearish contrarian trading bias from a sentiment standpoint.
See how shifts in USD/CAD retail positioning are impacting trend- Click here to learn more about sentiment!
AUD/NZD Weekly Price Chart
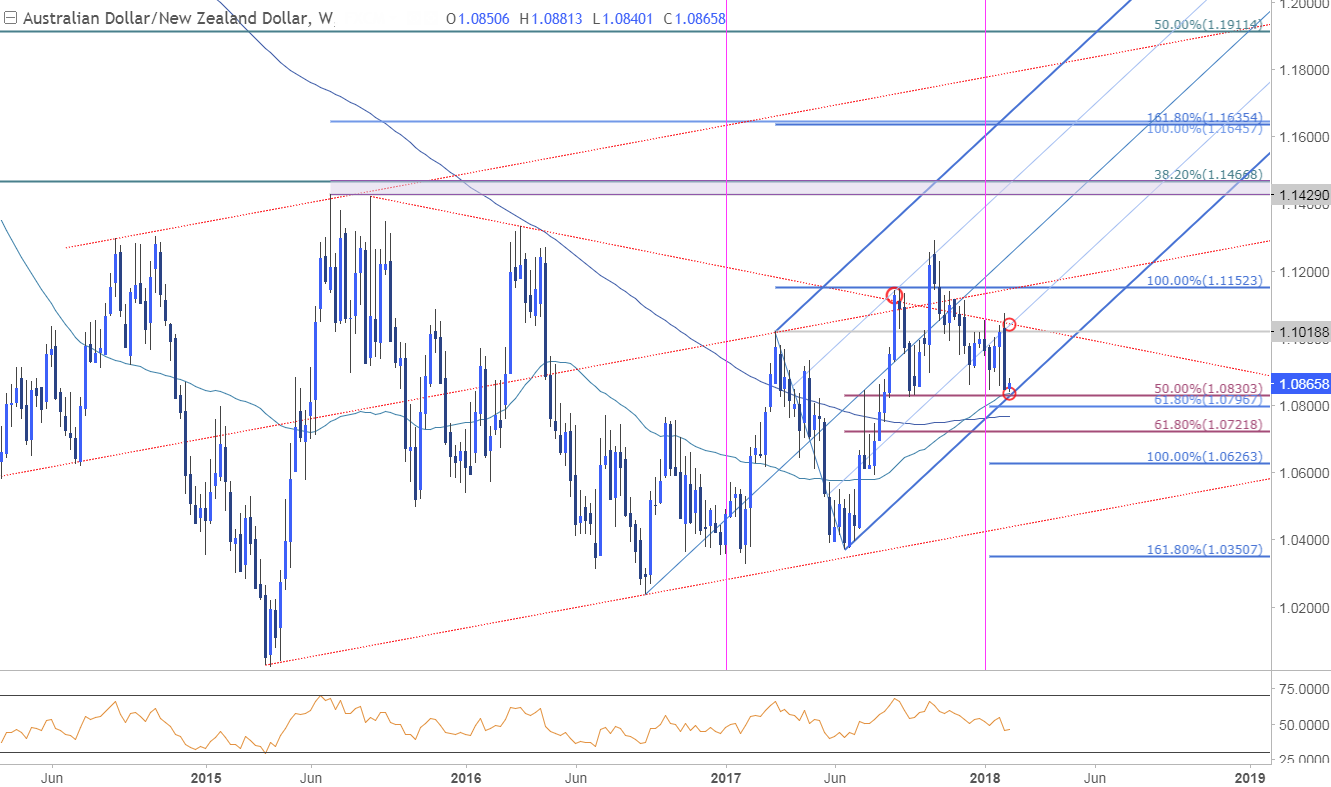
Notes: AUD/NZD is approaching a key range of support at 1.0791-1.0830 where the 50% retracement & 61.8% extension converge on the 52-week moving average and slope support. Note that last week marked an outside weekly-reversal candle and highlights the risk for a more significant breakdown if this level is compromised.
Bottom line: Look for a reaction this week on a drop into this key threshold with a weekly close below risking a drop towards the 61.8% retracement at 1.0722 and the 100% extension at 1.0626. Bearish invalidation stands at the 1.1018/60 resistance confluence.
Check out our New 2018 projectionsin our Free DailyFX Trading Forecasts
BTC/USD Weekly Price Chart (Log)
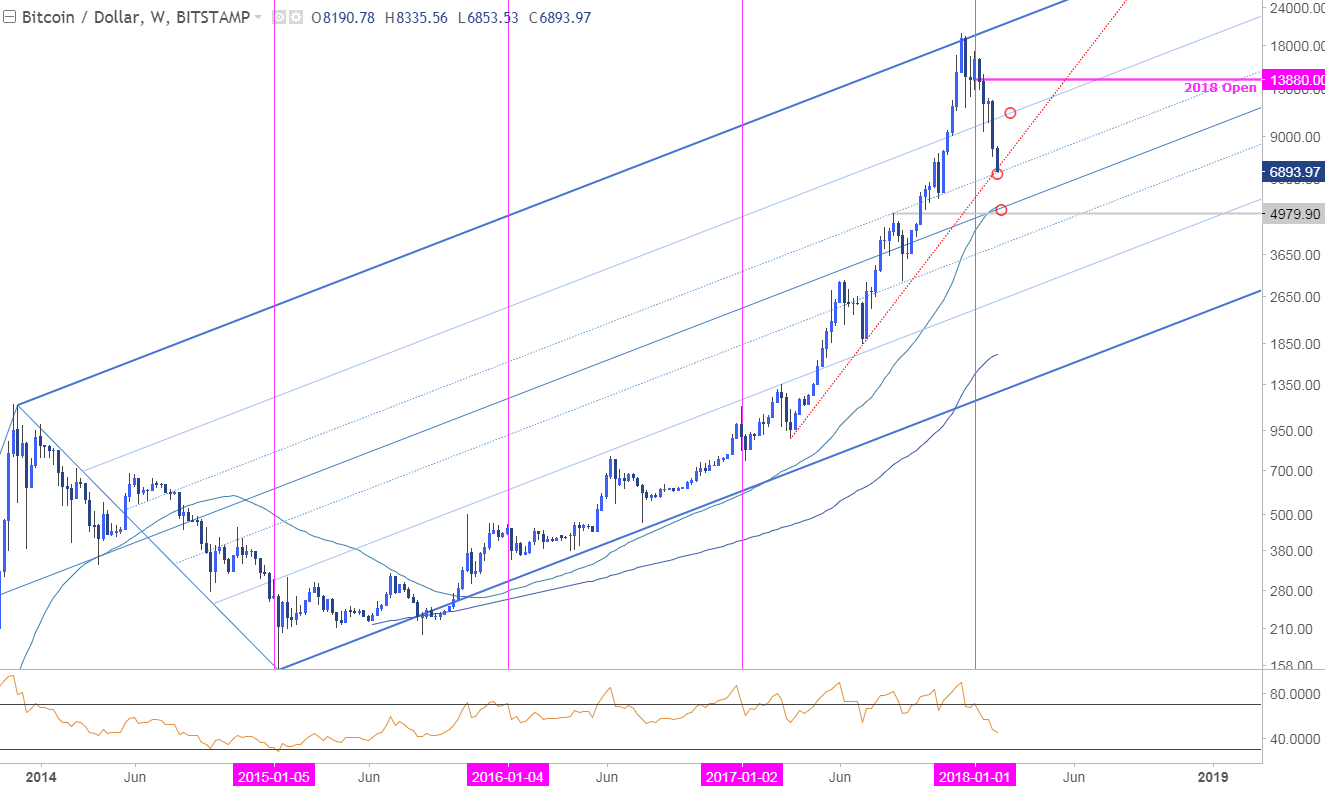
Notes: Bitcoin prices reversed sharply off the upper median-line parallel of a broad ascending pitchfork formation late-last year with last week’s break of a near-term consolidation pattern fueling further losses in the cryptocurrency. Price is now testing confluence slope support and while we could see a slight reprieve here near-term, the broader risk remains for a drop into the median-line. This feature converges on the August highs and 52-week moving average around 4980-5230.
Bottom line: IF price is going to rebound, this could be a good spot but the focus remains lower for now while below the 50-line around 10550s. From a trading standpoint, look for rallies off this mark to ultimately offer favorable short-entries targeting more meaningful support into the median-line. We’ll have to reassess from there.
New to Bitcoin Trading? Get started with this Free Beginners Guide
Previous Weekly Technical Perspectives
- Weekly Technical Perspective on DXY, USD/JPY and NZD/USD
- Weekly Technical Perspective on GBP/USD, USD/CAD, USD/CHF
- Weekly Technical Perspective on USD/JPY, EUR/JPY, Crude Oil
- Written by Michael Boutros, Technical Currency Strategist with DailyFX
Follow Michaelon Twitter @MBForex contact him at mboutros@dailyfx.com or Click Here to be added to his email distribution list.


