


- Bitcoin breaks near-term consolidation- Prices eyes technical support lower
- Check out our 2018 quarterly projections in our Free DailyFX Trading Forecasts
- Join Michael for Live Weekly Strategy Webinars on Mondays at 12:30GMT
BTC/USD Daily Chart (Log)
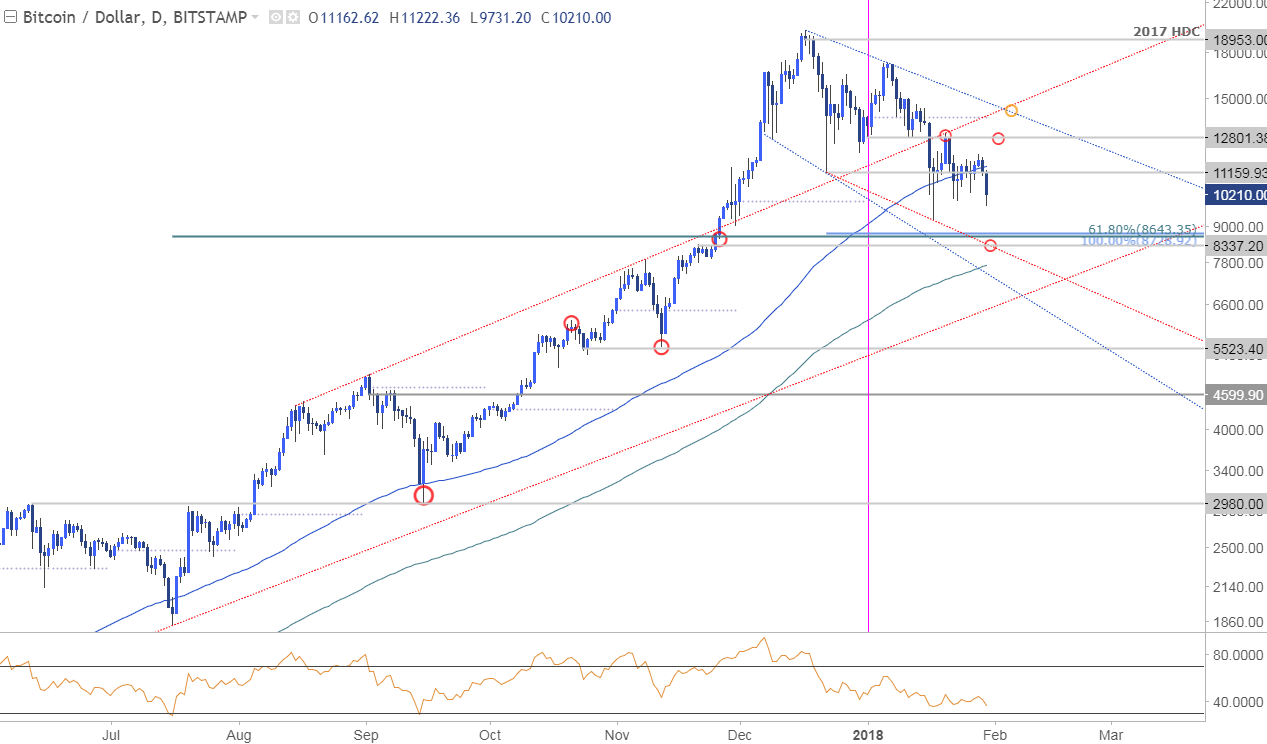
Technical Outlook: Earlier this month we documented the objective break of the January opening-range in Bitcoin prices as the decline was approaching initial support targets. We were looking, “for signs of a near-term exhaustion low in price for the rebound - but ultimately looking lower.”
Indeed price did rebound as high as 13052 before reversing sharply with the decline now once again approaching key confluence support at 8337-8643- a region defined by the 61.8% retracement of the July advance, the 100% extension of the decline off the record highs and basic slope support off the late-December low. Resistance remains with the monthly opening range lows at 12801 with bearish invalidation now lowered to the slope confluence at~14400/44 (note the monthly / yearly open at 13880).
New to Bitcoin Trading? Get started with this Free Beginners Guide
BTC/USD 240min Chart (Log)
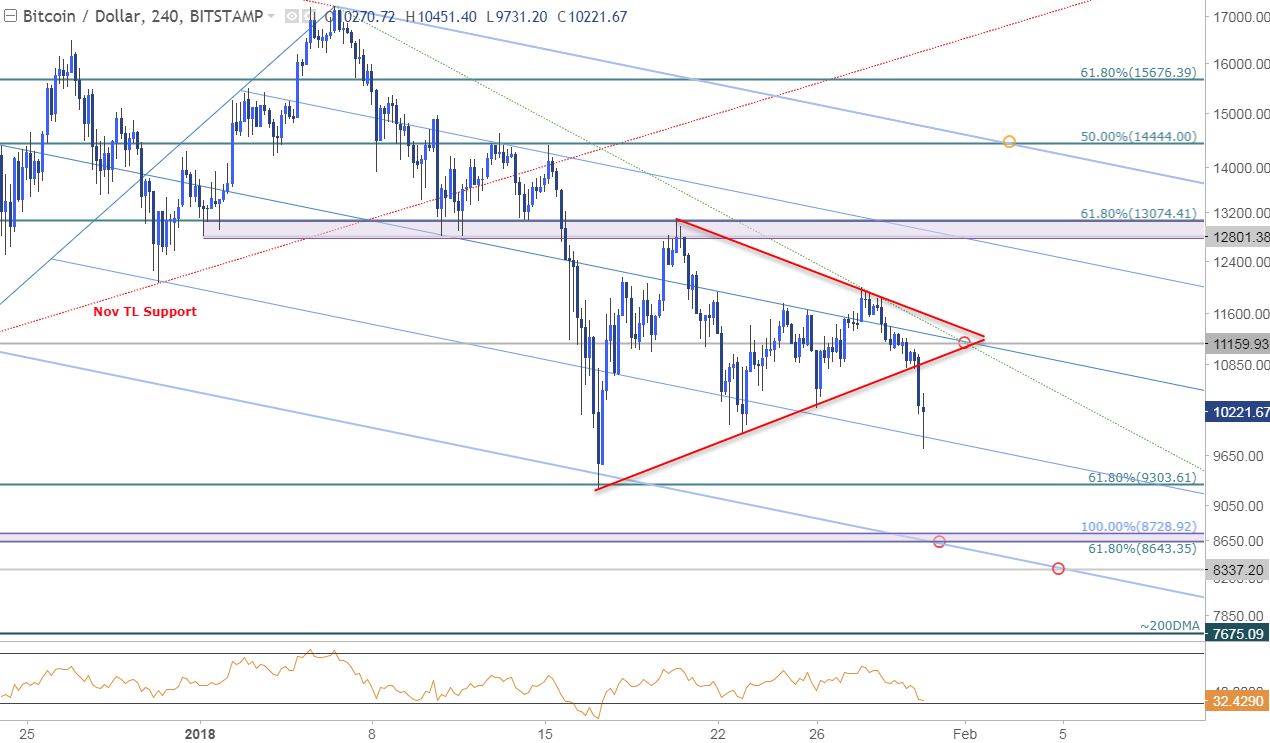
Notes: A closer look at price action sees Bitcoin breaking below a near-term consolidation pattern with the decline now approaching the January lows / 61.8% retracement of the September advance at 9300/03. If this break is legit, near-term rallies should be capped by 11160 with a break lower targeting 8643-8729 backed by the lower parallel / 8337- area of interest for near-term exhaustion / long-entries IF reached.
Why does the average trader lose? Avoid these Mistakes in your trading
Bottom line: I’ll favor fading strength while below 11160 for now targeting structural support. A break below this near-term downslope would be needed to suggest a much larger correction is underway with such a scenario eyeing subsequent support objectives at the 200-day moving average, currently around ~7675.
For a complete breakdown of Michael’s trading strategy, review his Foundations of Technical Analysis mini-series
Bitcoin IG Client Sentiment
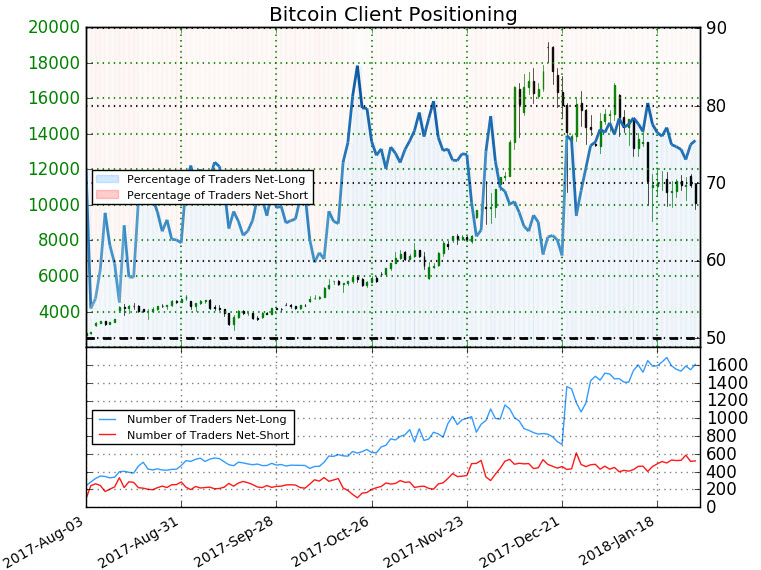
- A summary of IG Client Sentiment shows traders are net-long Bitcoin- the ratio stands at +3.08 (75.5% of traders are long) – bearishreading
- Long positions are 3.0% higher than yesterday and 4.2% lower from last week
- Short positions are 2.4% higher than yesterday and 0.8% lower from last week
- We typically take a contrarian view to crowd sentiment, and the fact traders are net-long suggests Bitcoin prices may continue to fall. However, traders are more net-long than yesterday but less net-long from last weekand the combination of current positioning and recent changes gives us a further mixed Bitcoin trading bias from a sentiment standpoint.
See how shifts in Bitcoin retail positioning are impacting trend- Click here to learn more about sentiment!
---
Other Setups in Play
- German DAX Signals Risk for Further Losses
- Weekly Technical Outlook- US Dollar Bears to Face FOMC, NFP
- USD/JPY Plummets to 4-Month Lows; More Pain to Follow?
- AUD/JPY Outlook Hinges on Break of Monthly Opening
- Written by Michael Boutros, Currency Strategist with DailyFX
To receive Michael’s analysis directly via email, please SIGN UP HERE
Follow Michael on Twitter @MBForex or contact him at mboutros@dailyfx.com


