


- AUD/JPY monthly opening-range break in focus, near-term risk lower sub-89.16
- Check out our 2018 quarterly projections in our Free DailyFX Trading Forecasts
- Join Michael for Live Weekly Strategy Webinars on Mondays at 12:30GMT
AUD/JPY Daily Chart
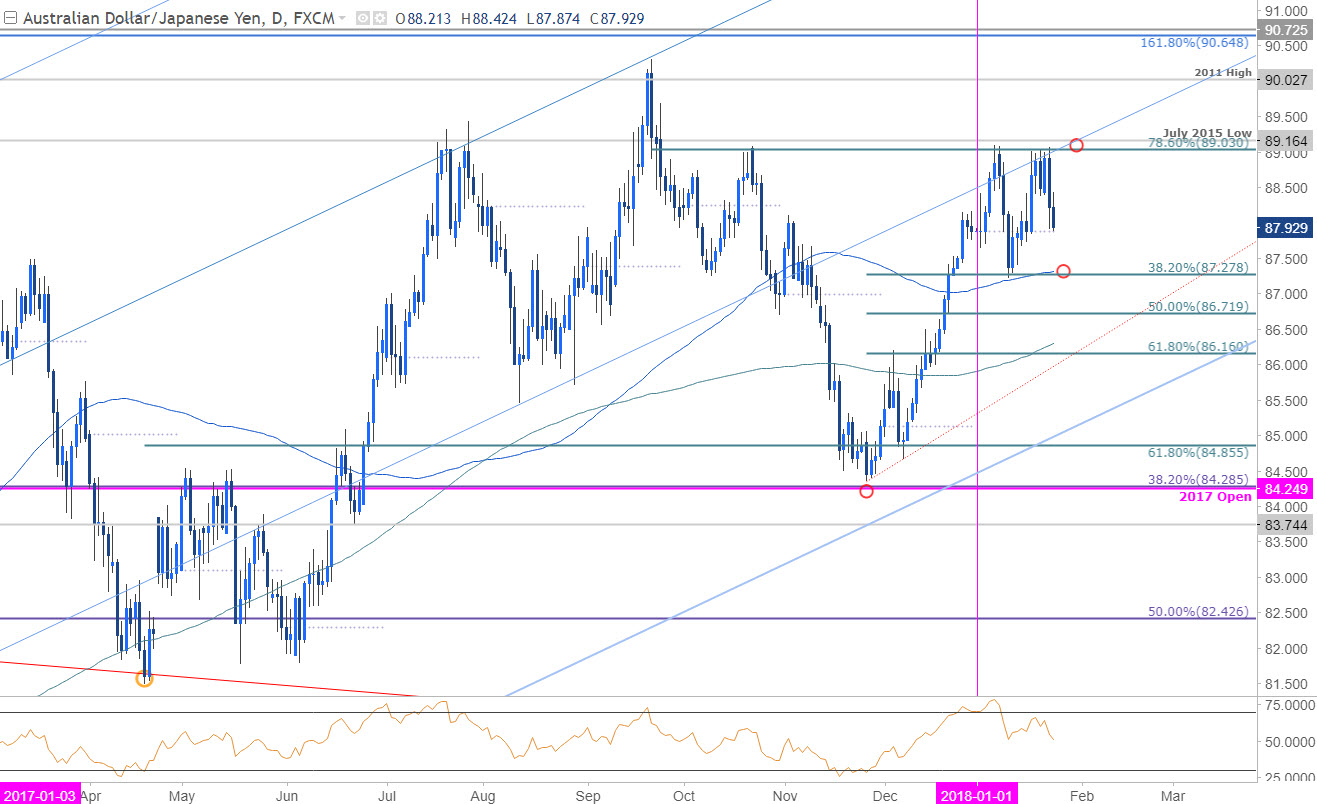
Technical Outlook: AUD/JPY has set a well-defined monthly opening-range between key technical levels just below up-trend resistance. Prices have continued to respect confluence resistance at 89.03/16- a region defined by the 78.6% retracement of the September decline and the July 2015 low. Note that an outside-day reversal off this threshold yesterday does put a bearish tilt on the pair near-term. Support rests at 87.28/33 where the 38.2% retracement of the November advance converges on the 100-day moving average. The medium-term outlook hinges on a break of this key range between 87.28-89.16.
New to Forex Trading? Get started with this Free Beginners Guide
AUD/JPY 240min Chart
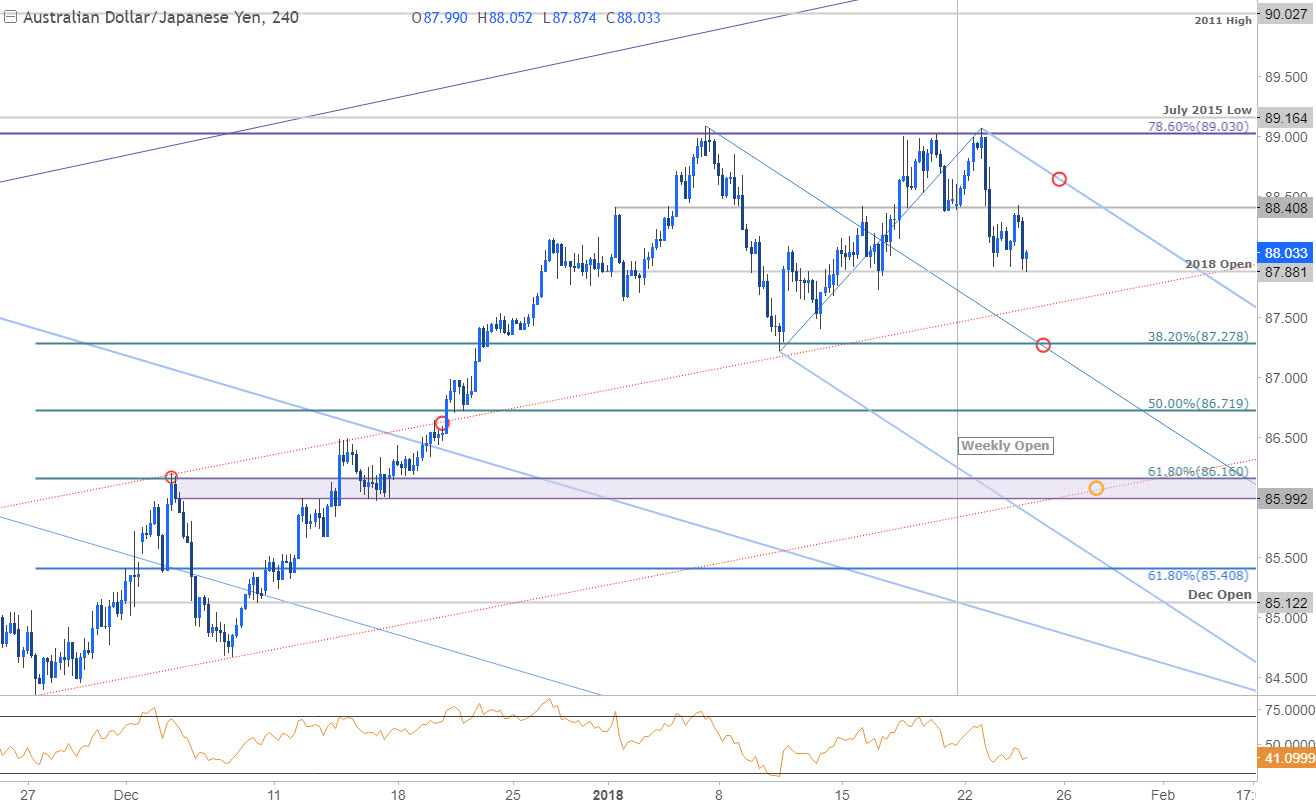
Notes: A closer look at near-term price action further highlights the monthly opening-range with price now testing yearly open support at 87.88. A break lower shifts the focus back towards the lower bounds of the range at 87.28- note that while it’s too early to rely on this newly identified pitchfork, the median-line further confluence support at 87.28. A daily close below this threshold would suggest a larger correction is underway with such a scenario targeting 86.72 & key support at 86.00/16.
Interim resistance stands with the weekly open at 88.41 with our near-term bearish invalidation level at the upper parallel. A breach above the monthly highs keeps the broader long-bias in play targeting the 2011 high at 90.03, the 2017 high at 90.31 and 90.65/72. Bottom line: the risk of a more significant pullback mounts with a downside break of the monthly range– until then, we’ll favor the short-side while within this near-term formation targeting the range lows.
For a complete breakdown of Michael’s trading strategy, review his Foundations of Technical Analysis mini-series
AUD/JPY IG Client Sentiment

- A summary of IG Client Sentiment shows traders are net-short AUDJPY- the ratio stands at -2.27 (30.6% of traders are long) – bullishreading
- Retail has remained net-short since Jan 16th; price is unchanged since then
- The percentage of traders net-long is now its lowest since Jan9thwhen AUDJPY traded near 88.084
- Long positions are 31.8% lower than yesterday and 20.8% lower from last week
- Short positions are 17.1% higher than yesterday and 11.0% higher from last week
- We typically take a contrarian view to crowd sentiment, and the fact traders are net-short suggests AUDJPY prices may continue to rise. Traders are further net-short than yesterday and last week, and the combination of current positioning and recent changes gives us a stronger AUDJPY-bullish contrarian trading bias from a sentiment standpoint.
See how shifts in AUD/JPY retail positioning are impacting trend- Click here to learn more about sentiment!
---
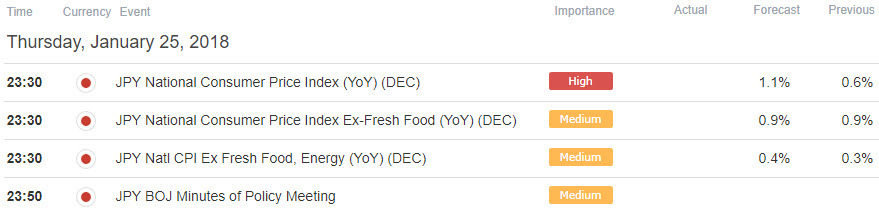
Relevant AUD/JPY Data Releases
Why does the average trader lose? Avoid these Mistakes in your trading
Other Setups in Play
- GBP/USD Breakout Underway - Topside Targets in View
- AUD/USD Rally Approaching Initial Resistance Targets
- Weekly Technical Outlook- USD Warning Signs of Stretched Price Action
- USD/CHF to See a Reprieve as Price Rebounds Off Support
- Written by Michael Boutros, Currency Strategist with DailyFX
To receive Michael’s analysis directly via email, please SIGN UP HERE
Follow Michael on Twitter @MBForex or contact him at mboutros@dailyfx.com


