


- A look at the weekly technicals on USD/JPY, EUR/JPY & Crude
- Review the Foundations of Technical Analysis mini-series
- Join Michael for Live Weekly Strategy Webinars on Mondays at 12:30GMT
In this series we scale-back and take a look at the broader technical picture to gain a bit more perspective on where we are in trend. Here are the key levels that matter heading into the shortened holiday week.
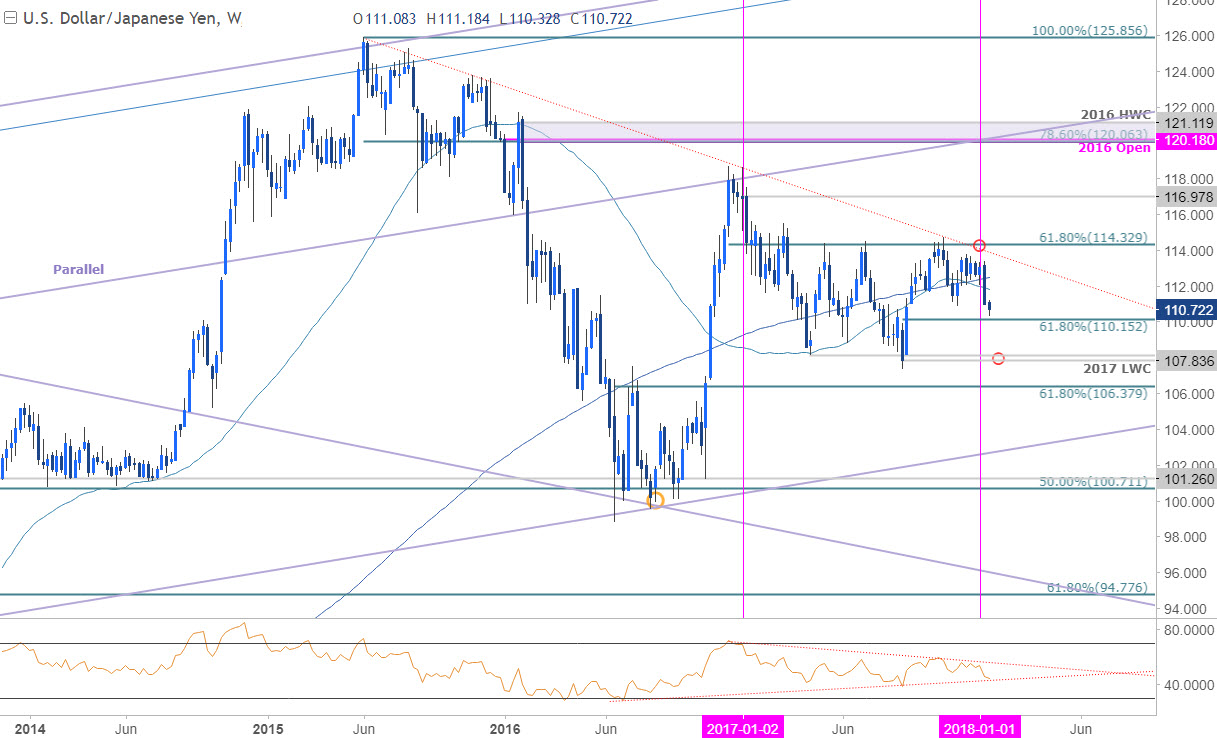
Notes: Last month we highlighted that our, “immediate focus is on a break of the 112.14-114.33 range to offer guidance,” with a downside break last week shifting the focus lower in USD/JPY. Interim support is eyed at the 61.8% retracement of the September advance at 110.15 backed by the March swing low / 2017 low-week close at 107.84 - 108.13- a break there would risk substantial losses with such a scenario targeting the 61.8% retracement of the 2016 advance at 106.38.
Bottom line: Price could see some rebound this week after this recent decline but the focus remains weighted to the downside while below the 200-week moving average which converges on the 2018 open at 112.50/65 with bearish invalidation steady at 114.33. From a trading standpoint, I’ll favor fading strength ultimately targeting a break sub-110.15.
New to Trading? Get started with this Free Beginners Guide
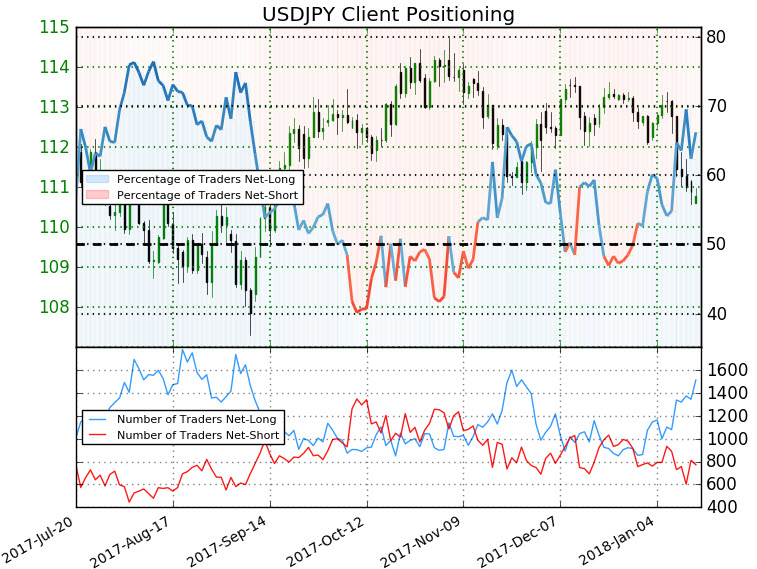
- A summary of IG Client Sentiment shows traders are net-long USD/JPY- the ratio stands at +1.96 (66.2% of traders are long) – bearishreading
- Retail has remained net-long since Dec 29; price has moved 2.2% lower since then
- Long positions are 12.2% higher than yesterday and 43.5% higher from last week
- Short positions are 7.0% lower than yesterday and 22.7% lower from last week
- We typically take a contrarian view to crowd sentiment, and the fact traders are net-long suggests USDJPY prices may continue to fall. Traders are further net-long than yesterday and last week, and the combination of current sentiment and recent changes gives us a stronger USDJPY-bearish contrarian trading bias.
See how shifts in retail positioning are impacting trend- Click here to learn more about sentiment!
EUR/JPY Weekly Chart
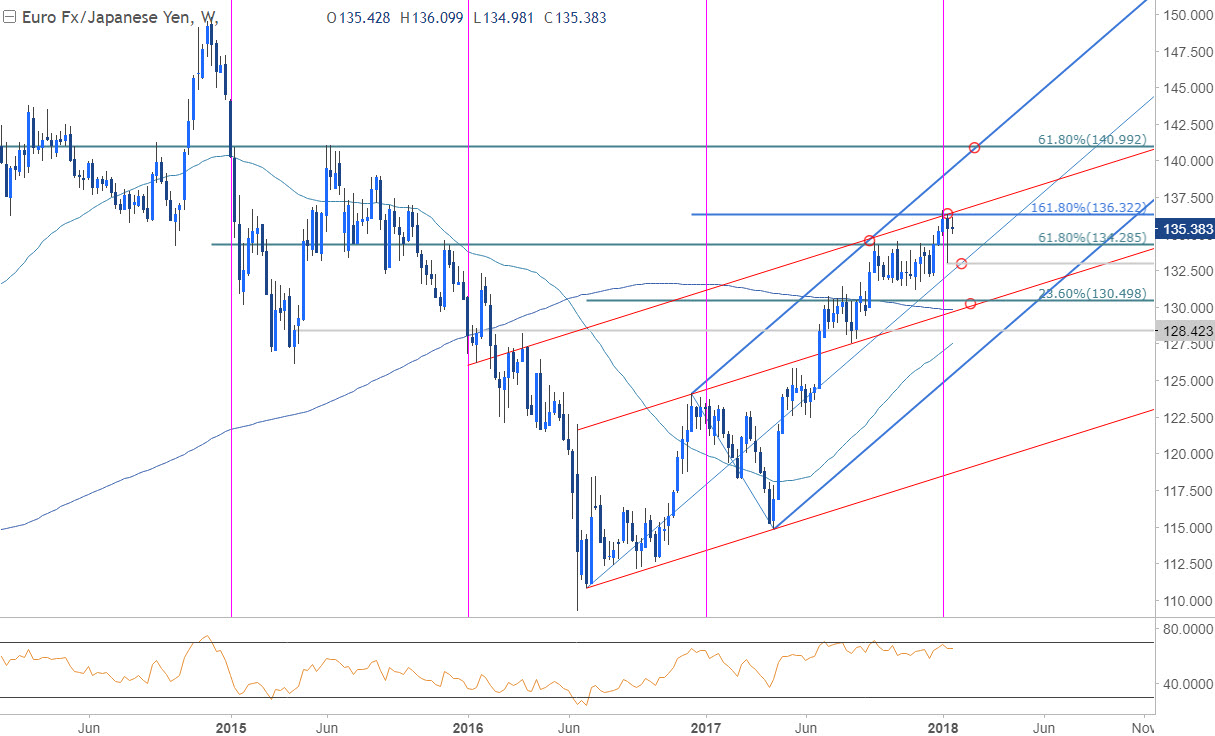
Notes: EUR/JPY is testing a key technical resistance confluence early in the year at 136.32 where the 161.8% Fibonacci extension converges on the basic parallel resistance. Note that the momentum profile continues to highlight ongoing bearish divergence and leaves the immediate advance at risk while below this threshold. Interim support rests at the monthly opening-range lows at the 133-handle with broader bullish invalidation set to 130.00/50- this region is defined by the 23.6% retracement of the late-2016 advance & the 200-week moving average and converges on basic slope support.
Bottom line: EUR/JPY is testing up-trend resistance with the immediate advance at risk sub-136.32. From a trading standpoint, I’ll favor fading weakness into structural support with a breach of the highs ultimately targeting a rally towards confluence resistance at 140.99.
Why does the average trader lose? Avoid these Mistakes in your trading
Crude Weekly Chart
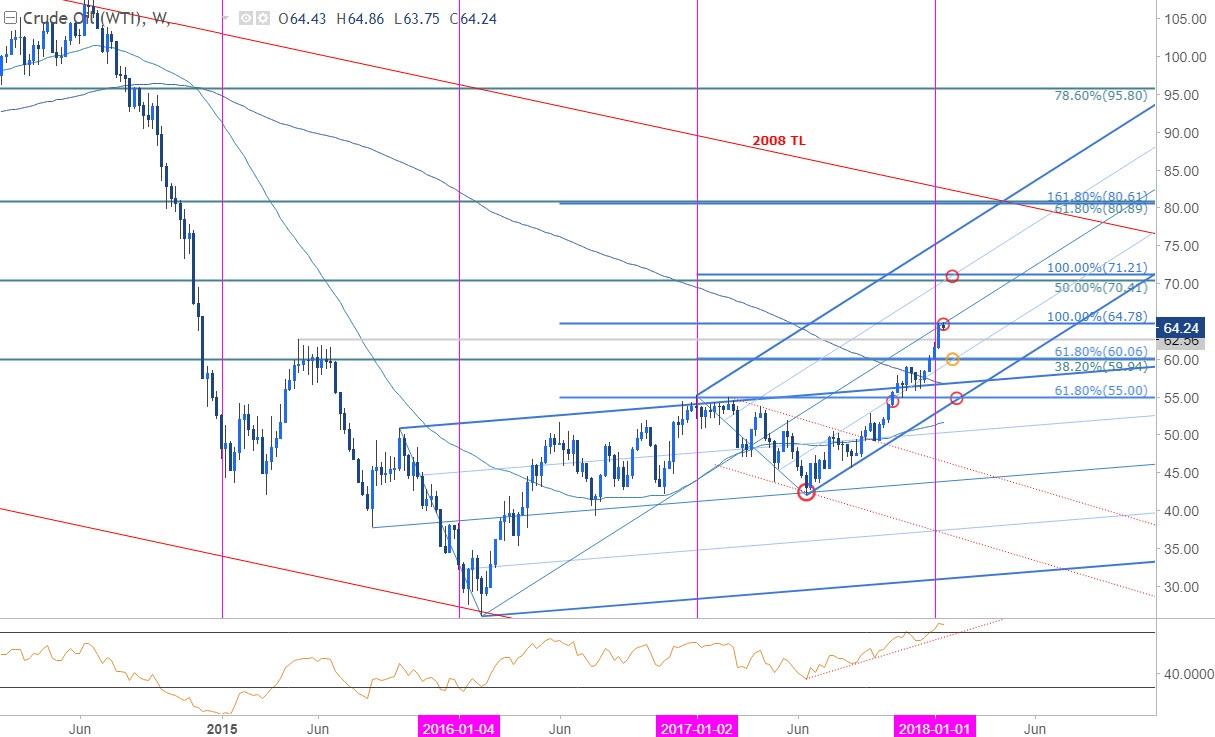
Notes: Last week we highlighted a key near-term resistance barrier in crude prices at 64.78- “this level is defined by the 100% extension of the 2016 advance and converges on the median-line of the ascending pitchfork formation we’ve been tracking for months now.” While the breach above the 55-handle late-last year keeps the broader focus higher in oil, the immediate advance remains vulnerable while below this threshold. Interim support rests at 59.94 – 60.06 with broader bullish invalidation steady at 55.
Bottom line: We’re on the lookout for a pullback in prices to offer more favorable long-entries while above 55 with a breach higher targeting a critical Fibonacci resistance confluence at 70.41-71.21.
Check out our New Crude Oil 2018 projectionsin our Free DailyFX Trading Forecasts
Previous Weekly Technical Perspectives
- A Weekly Technical Perspective on DXY, GBP/USD, AUD/USD
- A Weekly Technical Perspective on Gold, Copper, Crude
- A Weekly Technical Perspective on EUR/USD, USD/JPY, NZD/USD
- Written by Michael Boutros, Technical Currency Strategist with DailyFX
Follow Michaelon Twitter @MBForex contact him at mboutros@dailyfx.com or Click Here to be added to his email distribution list.


