


GOLD & CRUDE OIL TALKING POINTS:
- Gold prices stuck amid Brexit turmoil as US Dollar, bond yields diverge
- Crude oil prices brush off hefty 10.3 million barrel rise in US inventories
- S&P 500 futures hint at a return to risk-off trade to end the trading week
Commodity prices struggled for lasting direction Thursday. Gold prices were locked in place as worrying Brexit headlines weighed on bond yields and drove the US Dollar higher, putting the metal’s roles as anti-fiat benchmark and non-interest-bearing alternative in conflict.
Meanwhile, crude oil prices overlooked a dramatic build in US inventories. EIA data showed stockpiles added a hefty 10.3 million barrels last week, crushing forecasts calling for a 3.2 million barrel gain. The tepid response may reflect foreshadowing in API figures as well as the preceding record-setting selloff.
GOLD MAY STRUGGLE FOR DIRECTION AS OIL SELLOFF RESUMES
Looking ahead, a lull in top-tier scheduled event risk may put sentiment trends in the spotlight. Bellwether S&P 500 futures are pointing tellingly lower ahead, hinting at a risk-off bias. That may help keep gold anchored while crude oil succumbs to renewed selling pressure, falling alongside share prices.
Learn what other traders’ gold buy/sell decisions say about the price trend!
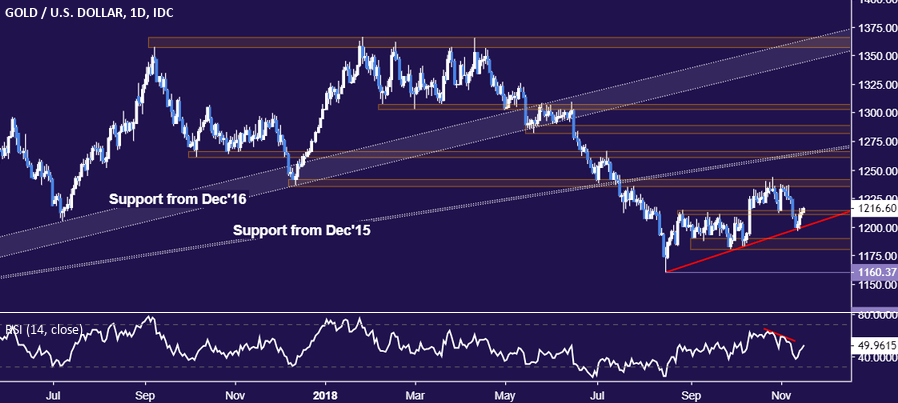
GOLD TECHNICAL ANALYSIS
Gold prices are probing above support-turned-resistance in the 1211.05-14.30 area, with break higher confirmed on a daily closing basis exposes the 1260.80-66.44 zone. Alternatively, a turn lower that breaches trend line support – now squarely at the $1200/oz figure – targets the 1180.86-87.83 region next.
CRUDE OIL TECHNICAL ANALYSIS
Crude oil prices continue to mark time above support in the 54.48-55.21 area. A daily close below this barrier opens the door for a test of the 52.34-83 zone. Alternatively, a reversal back above trend line support-turned-resistance – now at 58.74 – exposes the $60/bbl figure anew.

COMMODITY TRADING RESOURCES
- See our guide to learn about the long-term forces driving crude oil prices
- Having trouble with your strategy? Here’s the #1 mistake that traders make
- Join a Trading Q&A webinar to answer your commodity market questions
--- Written by Ilya Spivak, Currency Strategist for DailyFX.com
To contact Ilya, use the comments section below or @IlyaSpivak on Twitter


