


CRUDE OIL & GOLD TALKING POINTS:
- Crude oil prices pause to digest after longest losing streak on record
- Gold prices rise as yields fall in risk-off trade, US Dollar edges lower
- EIA inventory data due, S&P 500 futures hint at sentiment recovery
Crude oil prices paused to digest losses after suffering the longest losing streak on record. The spotlight now turns to EIA inventory flow data, where investors expect to see that stockpiles added 2.91 million barrels last week. An estimate from API called for a far larger 8.79 million barrel inflow. If official data registers closer to that outcome, the selloff may resume.
GOLD REBOUND MAY STALL AS BOND YIELDS RISE IN RISK-ON TRADE
Meanwhile, gold prices managed an upswing as the US Dollar continued to retrace recent gains while bond yields fell amid risk aversion, buoying the relative appeal of non-interest-bearing and anti-fiat assets. Bellwether S&P 500 futures now point convincingly higher however, hinting at a sentiment recovery that may cap the metal’s rebound as benchmark lending rates recover.
See our guide to learn about the long-term forces driving crude oil prices !
GOLD TECHNICAL ANALYSIS
Gold prices bounced to retest support-turned-resistance in the 1211.05-14.30 area. A break above it confirmed on a daily closing basis exposes the 1260.80-66.44 region next. Alternatively, a reversal below trend line support at opens the door for a test of the 1180.86-87.83 zone.

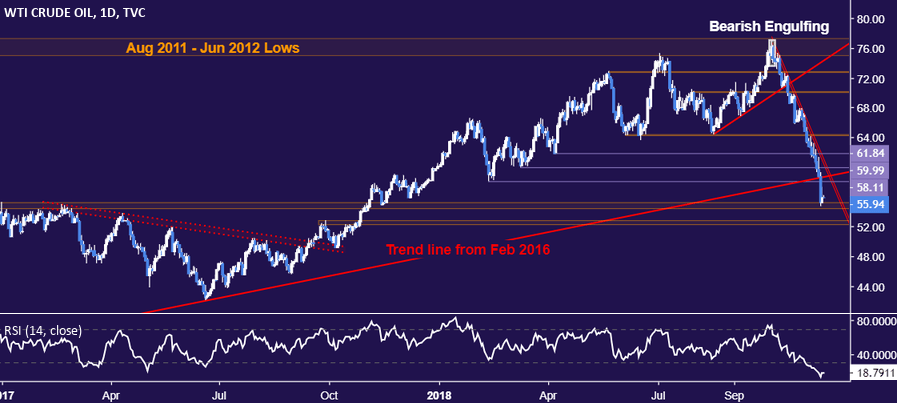
CRUDE OIL TECHNICAL ANALYSIS
Crude oil prices paused to digest losses at support in the 54.48-55.21 area after the longest string of consecutive losses on record produced a break of the rising trend established since February 2016, a rapid reversal seemingly confirming earlier signs of long-term topping. From here, a daily close below support exposes the 52.34-83 zone next. Alternatively, a bounce back above trend line support-turned-resistance at 58.71 paves the way to challenge the $60/bbl figure once again.
COMMODITY TRADING RESOURCES
- Learn what other traders’ gold buy/sell decisions say about the price trend
- Having trouble with your strategy? Here’s the #1 mistake that traders make
- Join a Trading Q&A webinar to answer your commodity market questions
--- Written by Ilya Spivak, Currency Strategist for DailyFX.com
To contact Ilya, use the comments section below or @IlyaSpivak on Twitter


