


US DOLLAR CURRENCY VOLATILITY RISES FURTHER AS SPOTLIGHT SHIFTS TO FED:
- USD price action oscillated around the latest central bank updates on monetary policy and is a trend likely to continue headed into the September Fed meeting next week
- US Dollar implied volatility continues to churn higher as uncertainty builds around the upcoming Fed interest rate decision and revised economic projections
- Read more on the Most Volatile Currency Pairs and How to Trade Them
With Thursday’s busy trading session winding down, the US Dollar is set to slide nearly 0.5% measured by the DXY Index – a popular US Dollar benchmark heavily weighted to EURUSD. USD price action has been quite choppy over the last 24-hours as forex traders overarchingly react to monetary policy updates from the ECB which detailed a rate cut and restart to QE. We drew attention to the heightenedpotential for sizable swings in the greenbackin our daily US Dollar price volatility report published earlier this week as the US Dollar gyrates around central bank decisions with attention now focused on the Fed.
DXY INDEX – US DOLLAR PRICE CHART: DAILY TIME FRAME (MARCH 29, 2019 TO SEPTEMBER 12, 2019)
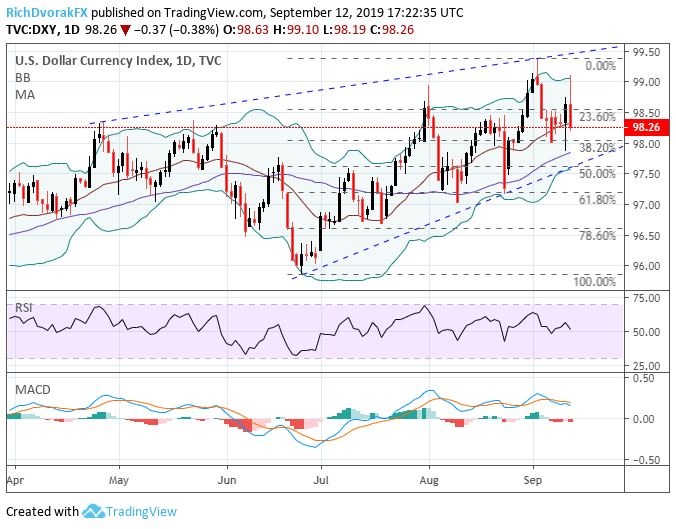
Chart created by @RichDvorakFX with TradingView
The US Dollar initially ripped higher during early Thursday trade on remarks out of the EU, but reversed quickly as ECB President Mario Draghi ended his press conference with an upbeat tone, which was exacerbated by reports that detailed key central bank officials opposed the resumption of QE. The DXY US Dollar Index continues to hold onto its 20-day simple moving average, however, and is expected to maintain its recent range roughly between the 97.50-99.50 price levels over the near term.
DXY INDEX – US DOLLAR PRICE CHART: 4-HOUR TIME FRAME (AUGUST 12, 2019 TO SEPTEMBER 12, 2019)

Chart created by @RichDvorakFX with TradingView
Honing in on US Dollar price action over the last month we find that the DXY Index currently rests near the mid-point retracement of its recent trading range. We have previously detailed this area of technical confluence around the 98.25 mark underscored by swing highs recorded in April, May and throughout August. USD bulls may look to the 98.00 handle for potential technical support as well as its uptrend line extended from the August 25 and September 11 intraday lows, but the DXY Index’s year-to-date peak and Thursday’s swing high printed in the wake of the ECB decision could keep a lid on US Dollar upside as the September Fed meeting approaches.
US INFLATION INCHING CLOSER TO FEDERAL RESERVE TARGET

The choppy trading range recently formed by the US Dollar is not entirely shocking when contrasted against the US economy’s fundamental backdrop and the Federal Reserve’s stated dual mandate. One of the two primary objectives directing the decisions of Fed Chair Jerome Powell and the Federal Open Market Committee (FOMC) is price stability near the central bank’s symmetric 2% inflation target. Seeing that the latest reading on inflation jumped to 2.4%, which marks the current expansion cycle’s high, it may be difficult for the Federal Reserve to justify an interest rate cut at its monetary policy update next Wednesday.
The Fed’s preferred measure of inflation is core personal consumption expenditures (PCE), however, which has been running closer to 1.5% recently. Yet, it is worth mentioning that Chair Powell labeled the first Fed rate cut in over a decade this past July as a mere “mid-cycle adjustment” and not the start of a full-blown series of dovish policy actions. Although, cratering business investment as well as stumbling consumer sentiment and expectations surrounding future economic prospects – primarily driven by ongoing US-China trade war uncertainty – remains a concern of the Fed and is a theme that may possibly weigh in on its next move.
FED TO FIGHT US TREASURY YIELD CURVE INVERSION-INDUCED RECESSION FEARS

At the same time, thawing US-China trade tensions could sway FOMC members to favor a firmer stance than what is currently priced in by markets. While Powell has stated that the Fed remains independent from US politics – including refraining from getting involved in the Trump administration’s trade policy agenda – the Federal Reserve will likely “act as appropriate to sustain the expansion” as noted in the central bank’s last monetary policy statement. That said, aggressive front-loading of expected Fed rate cuts has helped drag the US Treasury yield curve inversion – a closely watched recession indicator – back to a positive spread.
Consequently, the scenario where the Fed follows in the ECB’s footsteps and delivers a 25-basis point interest rate cut at its next meeting is expected to be the most probable outcome. If a modest 0.25% interest rate cut is accompanied by firm guidance and an upbeat economic outlook, it will likely bode well for bullish US Dollar prospects. However, it is possible that calls for further monetary policy accommodation will be met with increased resistance.
FED MONETARY POLICY UNCERTAINTY PROPELLING US DOLLAR IMPLIED VOLATILITY

Voting FOMC members Esther George and Eric Rosengren already dissented the central bank’s last decision to lower the target federal funds rate to its current 2.00-2.25% range. The second most likely scenario for the next Fed meeting could see the Fed refusing to capitulate to the market’s arguably lofty rate cut bets, which has the most potential to bolster US Dollar prices.
The third yet least expected outcome out of next week’s Fed meeting is an accelerated dovish tilt alongside more aggressive policy accommodation, which stands to be bearish for the greenback. Alas, with such heightened uncertainty surrounding Fed monetary policy and what the central bank’s next action will be, the rise in implied volatility readings for the US Dollar is to be expected.
US DOLLAR IMPLIED VOLATILITY & TRADING RANGES (1-WEEK)

In fact, 1-week implied volatility on the DXY US Dollar Index just notched its highest reading since March 28. Less broadly, two of the most notable changes in 1-week US Dollar implied volatility readings draws attention to the Australian Dollar and Swiss Franc. The recent AUDUSD rally may fizzle out and send spot prices reversing back lower as implied volatility spikes – particularly if the Fed takes a relatively firm stance. At the same time, a dovish leaning stands to thwart the USDCHF rally grinding into resistance.
-- Written by Rich Dvorak, Junior Analyst for DailyFX.com
Connect with @RichDvorakFX on Twitter for real-time market insight


