


US Dollar Talking Points:
- The US Dollar is trading at fresh two-year-highs following yesterday’s FOMC rate cut.
- Despite the fact that this was the Fed’s first cut in a decade, the Dollar has rallied as the bank wasn’t as dovish as what markets were looking or hopeful for. This has led to a pullback in equities that found support ahead of yesterday’s US close, and a breach of short-term support in Gold prices as bets on future rate cuts have diminished on the back of yesterday’s outlay.
- The economic calendar for this week is not done yet, as tomorrow brings Non-Farm Payrolls data for the month of July and this will likely keep these themes on the move.
- DailyFX Forecasts are published on a variety of markets such as Gold, the US Dollar or the Euro and are available from the DailyFX Trading Guides page. If you’re looking to improve your trading approach, check out Traits of Successful Traders. And if you’re looking for an introductory primer to the Forex market, check out our New to FX Guide.
US Dollar to Fresh Two-Year-Highs on FOMC Rate Cut
Yesterday saw the first rate cut out of the Federal Reserve since the Financial Collapse. But for traders or market participants going into this rate decision looking for hints as to what the bank may do next, they’re likely going to have to wait around for the September rate decision as FOMC Chair Jerome Powell didn’t really tip his hand as to what may be around the next corner.
From the press conference – it appears as though this move was an ‘insurance cut’ rather than driven by data, and it also looks like the FOMC is concerned about global risks and looking to get in-front of any potential slowdown that may follow. One item that did stick out was the fact that Chair Powell framed this cut as an isolated action rather than the start of a new trend of softening, and rates markets reacted fairly-quickly, factoring in a less-dovish Fed as Chair Powell avoided the topic of future cuts. At this point, there’s an almost 50/50 chance of getting another cut in September, and an 80.7% chance of at least one more cut by the end of the year. Going out to December – there’s a 37.1% chance of at least two more cuts from the FOMC before year-end.
US Rate Expectations To December, 2019 (per CME Fedwatch)

Chart prepared by James Stanley; data from CME Fedwatch
In response to this less-dovish outlay a number of reactions showed. The US Dollar has spiked up to a fresh two-year-high, US equities remain on their back foot after a quick dip around the start of yesterday’s presser; and perhaps most interesting for longer-term approaches, Gold prices have started to push beyond short-term supports, exposing longer-term support potential that hasn’t yet been able to come into play after the excitement of June in the yellow metal.
The US Dollar breakout is particularly interesting as this theme has continued to price-in after yesterday’s US close. The currency is now in a fresh bullish breakout with the 99.00 level clearly in-view.
US Dollar Weekly Price Chart: Fresh Two-Year Highs
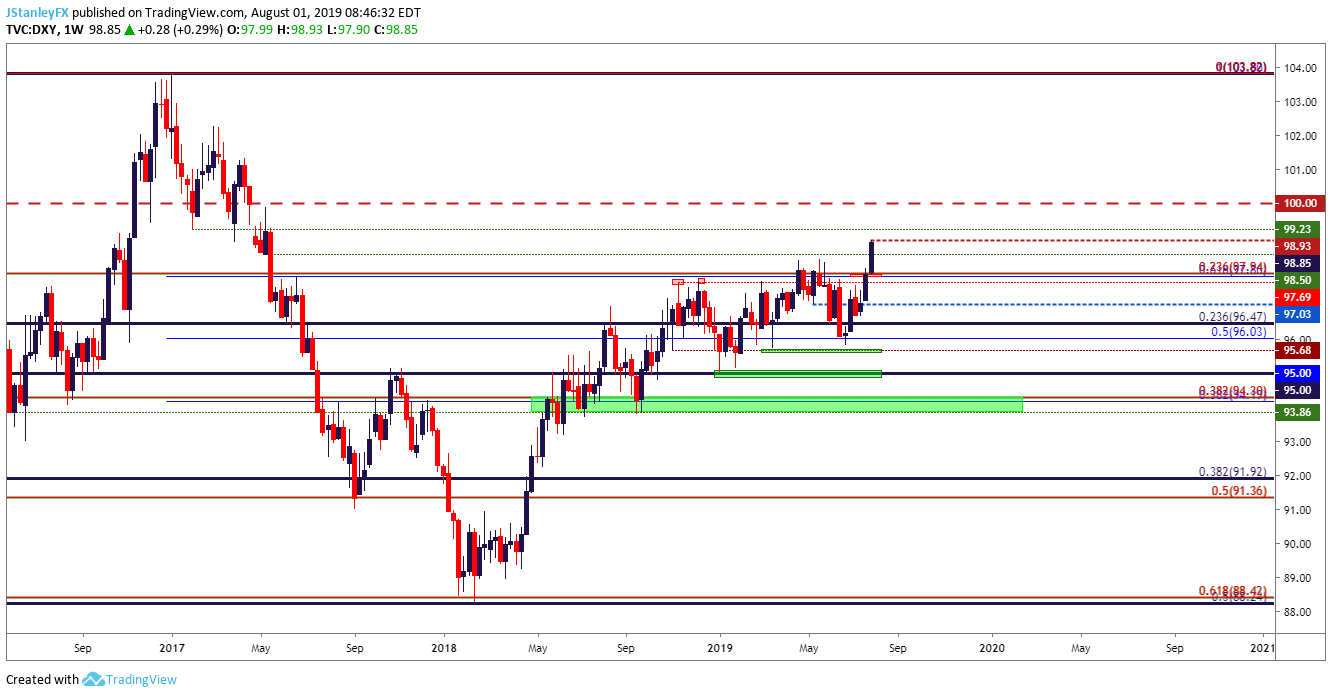
Chart prepared by James Stanley; created with Tradingview (chart link)
Getting a bit closer on the chart, and bulls have slowed-down just shy of the 99.00 level and that resistance has thus far held into early-US trade. Tomorrow brings another item of interest with July NFP’s, and this will likely keep the currency on the move. For traders looking to treat this breakout aggressively to the long-side, bullish breakout potential exists beyond the current swing-high, with target potential near-by around 99.23. For those that’d like to move-forward on USD a bit more conservatively, a pullback to support around prior short-term resistance, taken from around 98.50-98.60 could open the door for bullish exposure. Or – for those that’d like to be even more conservative, that pullback support could be awaited around the prior swing-high taking place around 98.33.
US Dollar Hourly Price Chart
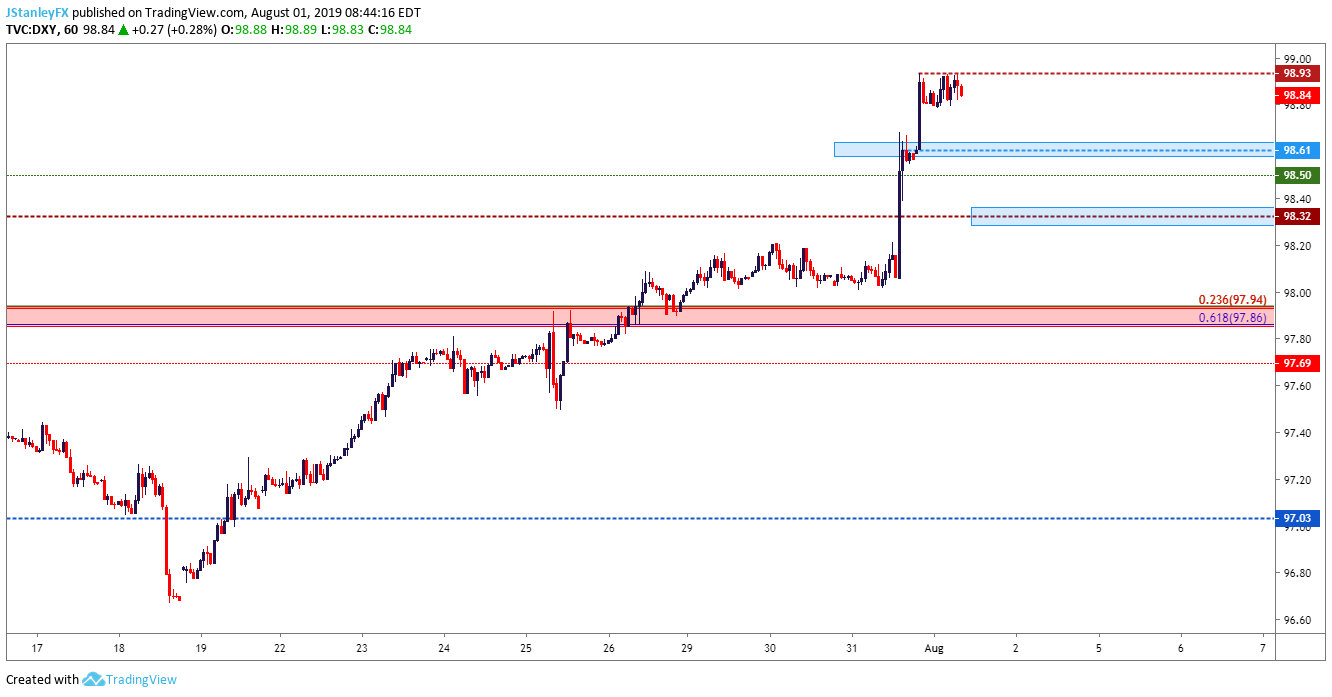
Chart prepared by James Stanley; created with Tradingview (chart link)
US Equities on their Back Foot
The big focal point for today will be US equities, carrying the question as to how markets will respond following yesterday’s less-than-dovish outlay. The immediate response yesterday was a quick burst of weakness, with the S&P 500 tilting below 3k and all the way down to the 2960 level that had previously functioned at the all-time-high. That level came-in as support, buyers quickly responded and prices rushed-higher into the US close. That bounce has largely held in S&P futures overnight, but the big question is whether sellers will make another appearance after the open of today’s US session.
S&P 500 Two-Hour Price Chart
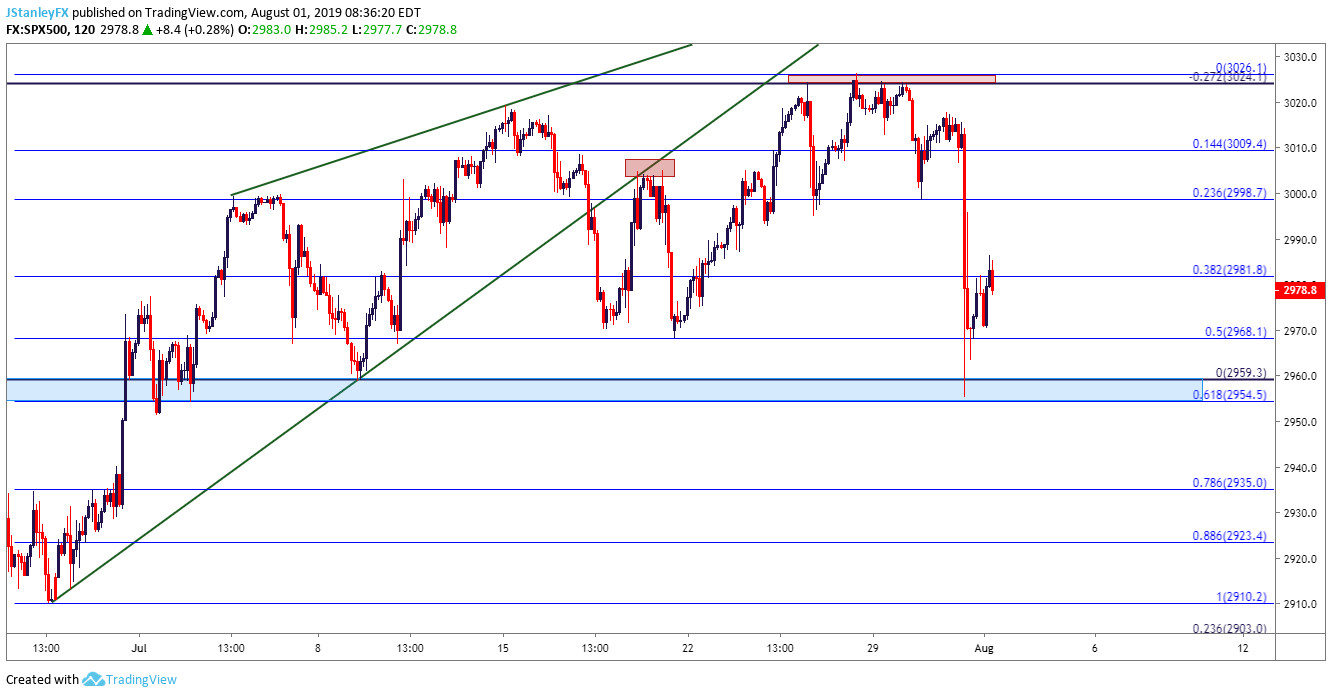
Chart prepared by James Stanley; created with Tradingview (chart link)
Gold Prices Head Back to 1400
Going along with that bullish backdrop in the US Dollar has been a support breach in Gold, taking out the 1415 level that had helped to hold the lows over the past couple of weeks. The 1400 level may remain of interest for those that want to approach Gold with an aggressively bullish approach; although longer-term support potential may remain as more attractive in areas such as 1375 or 1357.50. Each of those prices were significant areas of prior resistance that as yet, haven’t been tested for support since the June breakout took-hold.
Gold Eight-Hour Price Chart

Chart prepared by James Stanley; created with Tradingview (chart link)
To read more:
Are you looking for longer-term analysis on the U.S. Dollar? Our DailyFX Forecasts have a section for each major currency, and we also offer a plethora of resources on Gold or USD-pairs such as EUR/USD, GBP/USD, USD/JPY, AUD/USD. Traders can also stay up with near-term positioning via our IG Client Sentiment Indicator.
Forex Trading Resources
DailyFX offers an abundance of tools, indicators and resources to help traders. For those looking for trading ideas, our IG Client Sentiment shows the positioning of retail traders with actual live trades and positions. Our trading guides bring our DailyFX Quarterly Forecasts and our Top Trading Opportunities; and our real-time news feed has intra-day interactions from the DailyFX team. And if you’re looking for real-time analysis, our DailyFX Webinars offer numerous sessions each week in which you can see how and why we’re looking at what we’re looking at.
If you’re looking for educational information, our New to FX guide is there to help new(er) traders while our Traits of Successful Traders research is built to help sharpen the skill set by focusing on risk and trade management.
--- Written by James Stanley, Strategist for DailyFX.com
Contact and follow James on Twitter: @JStanleyFX


