


Stock Market Volatility Talking Points:
- Stock market volatility, reflected by CBOE’s VIX index, is heightened on the back of a trade war breakdown
- Can the relationship between the change in volatility and the change in the S&P 500 offer insight on future performance?
- With trade talks on the fritz and the month of May progressing, will the stock market crash and fulfill the “sell in May and go away” phenomenon?
Stock Market Volatility and its Relationship with S&P 500 Returns
After a series of Tweets from President Trump, global equities have found themselves on shaky ground. In the United States, the S&P 500 has shed -2.10% since Monday’s open with the Dow off -2.00% and the Nasdaq 100 down -2.85%. Simultaneously, CBOE’s Volatility Index or VIX, has spiked more than 50%. With an elevated VIX and pressured stocks, what can the relationship between the two tell us about future returns?
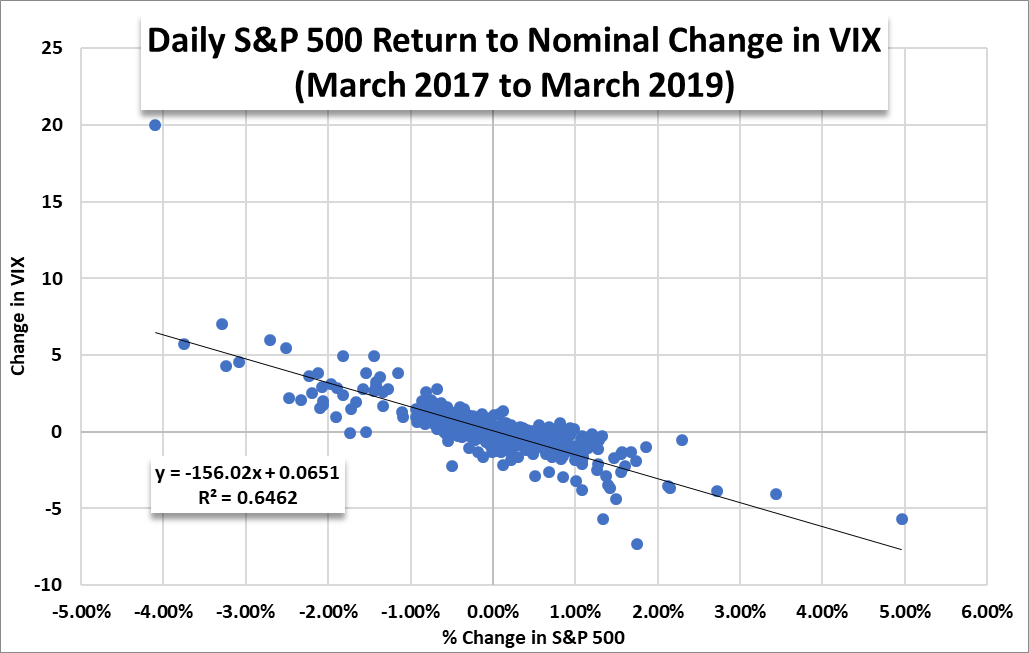
Data Source: Bloomberg
Over the last two years ending in March, the relationship between the S&P 500 and the VIX has been statistically significant at 64.6%. Some traders use the VIX as a tool to gauge when selling is overdone, or when complacency has taken hold. It is worth noting that the relationship is not always inverse.
The above graph displays multiple trading days during which a rise in the VIX was accompanied by an increase in the S&P 500. A consistent increase in both could suggest rising instability, potentially hinting that the market is reaching a top.
Conversely, there are days when the VIX has declined but the S&P 500 was unable to post a gain. These instances likely follow significant periods of volatility where the VIX is heightened after a period of uncertainty or risk has subsided.

Data Source: Bloomberg
Over a shorter period, the relationship is even more significant – with an R-squared value of .72. Compared to the same period in the year prior, there is a weaker correlation between the two. This disparity could be explained in part by the condition of the stock market during the two periods. In 2018, April followed an extremely volatile February and March – beginning the month at above average levels. On the other hand, April 2019 experienced little volatility and offered the lowest average monthly VIX since September 2018.

Data Source: Bloomberg
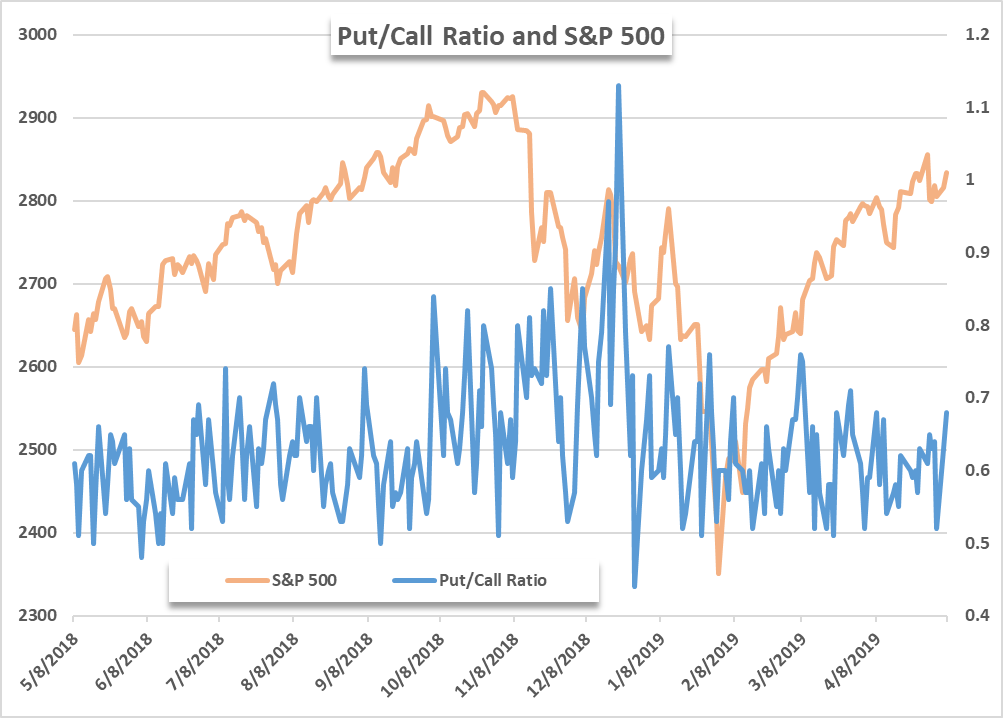
As the market digests the trade war turmoil and the May 10 deadline nears, traders remain on high alert. To that end, CBOE’s put-to-call ratio is at a 1-month high of 0.68. That said, traders can look to explore stock market volatility with our how to trade volatility guide. In the meantime, follow @PeterHanksFX on Twitter for further equity insight.
Data Source: Bloomberg
--Written by Peter Hanks, Junior Analyst for DailyFX.com
Contact and follow Peter on Twitter @PeterHanksFX
Read more: Will the Stock Market Crash in 2019?
DailyFX forecasts on a variety of currencies such as the US Dollar or the Euro are available from the DailyFX Trading Guides page. If you’re looking to improve your trading approach, check out Traits of Successful Traders. And if you’re looking for an introductory primer to the Forex market, check out our New to FX Guide.


