


US Dollar, EUR/USD, GBP/USD Talking Points
- After a strong month of September, the US Dollar has been fairly messy so far in October.
- With the election coming up in just a few weeks, that messiness may remain – but that can open the door for themes to play out via other currencies in major FX pairs.
- The analysis contained in article relies on price action and chart formations. To learn more about price action or chart patterns, check out our DailyFX Education section.
The US Dollar is fairly messy at the moment. And with a pretty pensive Presidential election coming up in a few weeks, that fact may remain, at least in the near-term.
Hopes for additional stimulus provide fuel for sellers while technical traders may be more attracted to the longer-term support that came into play in September, coupled with the bullish engulfing bar from last month’s US Dollar chart. But, so far in October, USD price action has pretty much been a wash as a doji is currently showing for October on the monthly (a near dragonfly doji but, a doji nonetheless).
Want to learn more about dojis or bullish engulfing patterns? Check out DailyFX Education
US Dollar Monthly Price Chart
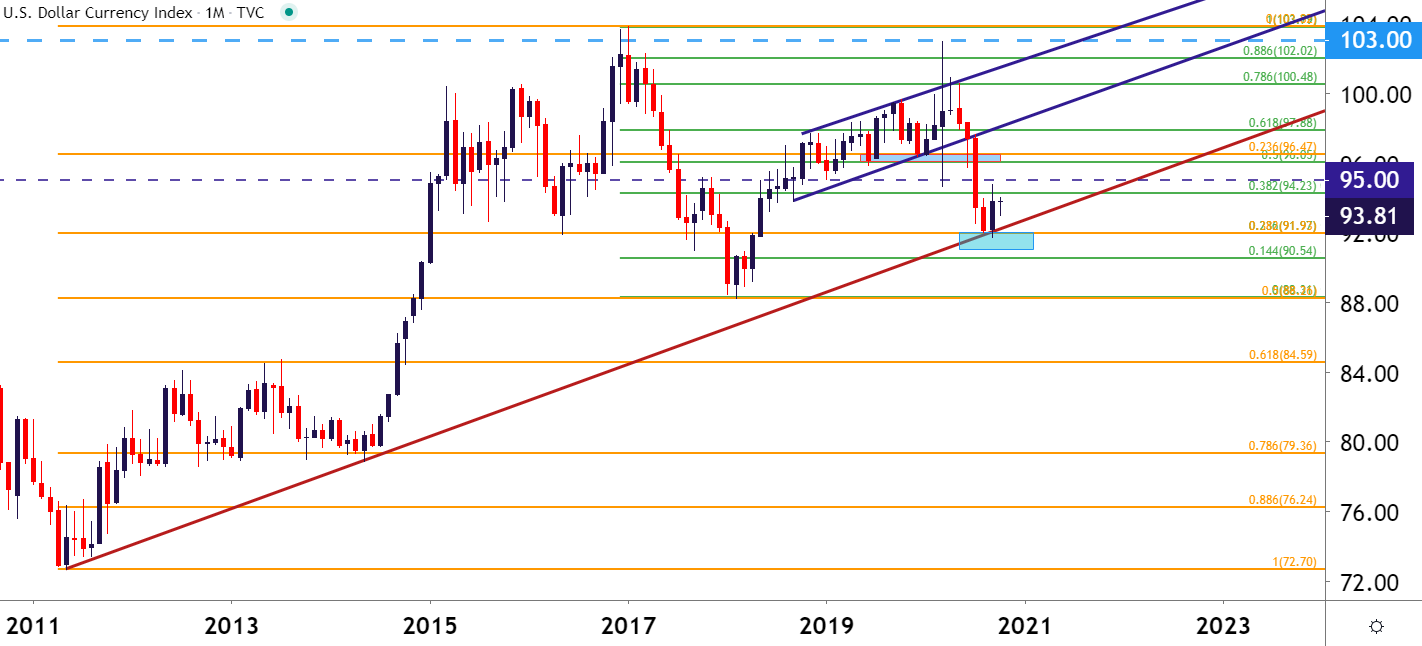
Chart prepared by James Stanley; USD, DXY on Tradingview
EUR/USD Sets Fresh October Low
While DXY still has yet to encroach upon it’s October swing-high, EUR/USD dipped down to a fresh October low earlier today. Support appears to be playing in from around the August low at 1.1694, with an assist from the 1.1700 level. But just a bit-higher on the chart is a big zone of potential resistance running from 1.1736-1.1750. I had previously used that zone as support last week and that led to a mild bounce up to 1.1831. But, matters have shifted since then and EUR/USD has put in a series of lower-lows and lower-highs, keeping the door open to bearish continuation scenarios.

This can put emphasis on that prior support zone as potential resistance.
EUR/USD Four-Hour Price Chart

Chart prepared by James Stanley; EUR/USD on Tradingview
GBP/USD: Possible Bear Flag, Support Test at Big Zone
I had published on GBP/USD a little earlier today and as I had shared there, this setup could be approached in either a bullish or a bearish direction. On the bullish side – a big level of support had just re-entered the picture around the 1.2900 level. The price of 1.2896 is the 50% marker of the 2018-2020 major move; and this is currently confluent with a trendline that can be derived from late-September and mid-October swing-lows.

This can keep the door open, near-term, to topside plays, looking for a revisit towards the 1.3000 zone of resistance that came into play earlier this week. But – if support breaks down, the short-side theme could quickly come back again as the bear flag breach opens the door for a move down towards the familiar 1.2712 area of the chart the held the September sell-off.
GBP/USD Four-Hour Price Chart

Chart prepared by James Stanley; GBP/USD on Tradingview
--- Written by James Stanley, Strategist for DailyFX.com
Contact and follow James on Twitter: @JStanleyFX


