


EUR/USD, Euro Talking Points:
- EUR/USD price action has returned to a key spot on the chart.
- The ECB doesn’t appear overly concerned about spot rates for the single currency: Euro inflation numbers are on the economic calendar for later this week.
- The analysis contained in article relies on price action and chart formations. To learn more about price action or chart patterns, check out our DailyFX Education section.
EUR/USD has returned to a key spot on the chart this morning and, so far, that price has helped to hold the lows. But at this early stage of the matter sellers don’t appear to be deterred, begging the question of for how long might this support zone hold the lows?
This was the same zone of support looked at last week in the pair, which held as EUR/USD went on a quick run up to the 1.1825 level. But after a small gap-lower to start this week’s trade and a Doji formation printing on Monday, sellers are taking a more aggressive swing while pushing prices back down to this key spot of support on the chart.
EUR/USD Hourly Price Chart: Return to Key Zone
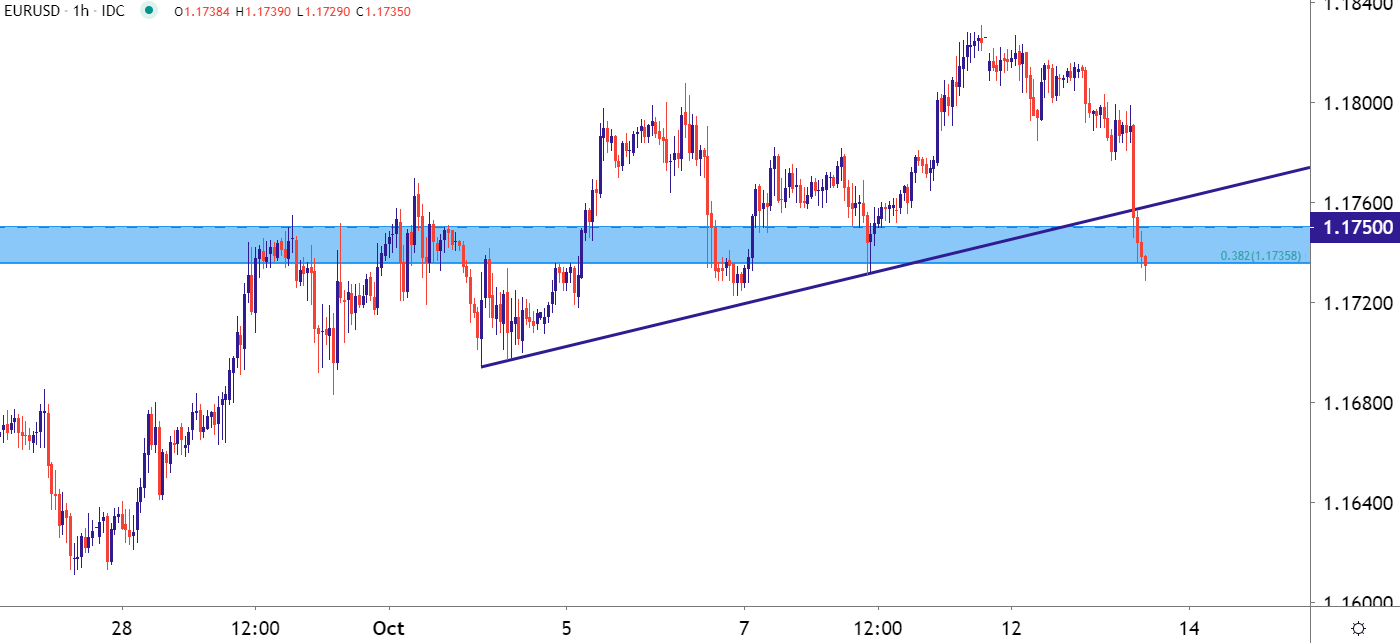
Chart prepared by James Stanley; EUR/USD on Tradingview
The 1.1736 level is a big one, and when connected to the psychological level just a bit above that at 1.1750, creates a confluent zone on the chart. This zone has had pull on EUR/USD price action going back to July of 2017, when it helped to set over multiple instances in the following five months; only to be-purposed as resistance from June through September of 2018.

That zone came back into play this July, and has been in the equation over the past few months.
EUR/USD Weekly Price Chart
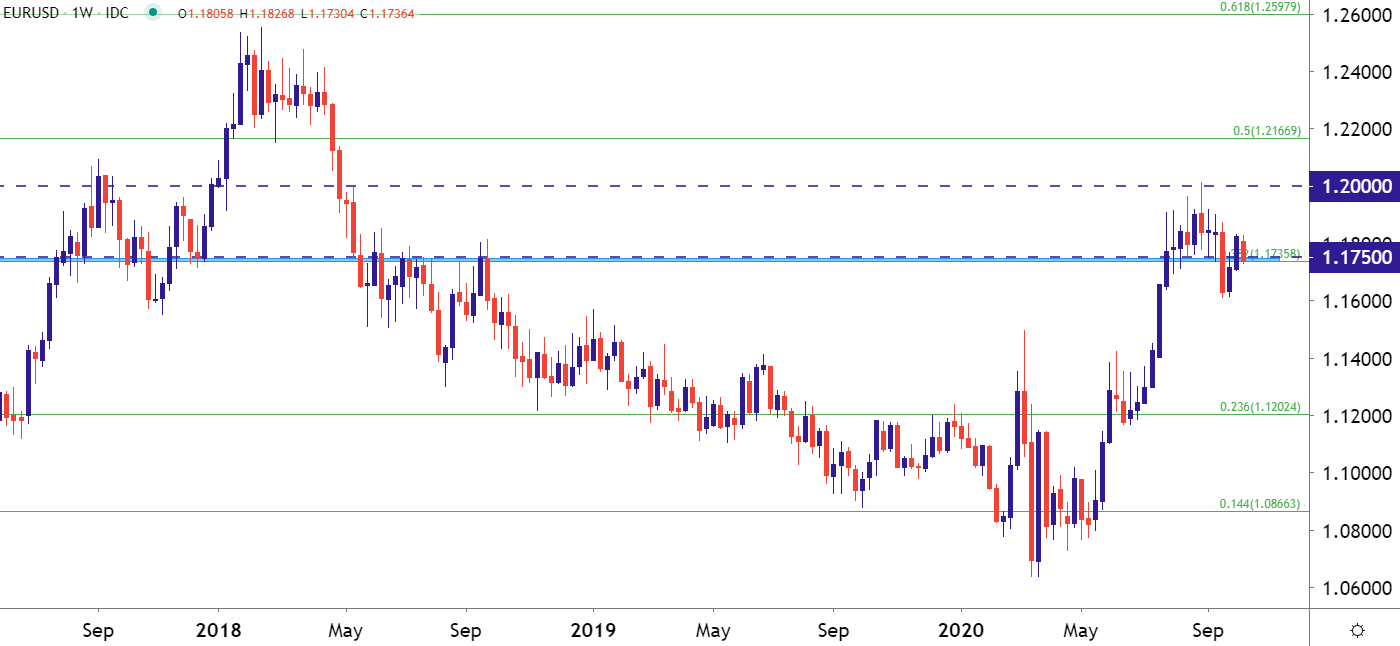
Chart prepared by James Stanley; EUR/USD on Tradingview
EUR/USD Near-Term Strategy
The big question at this point is whether there’s a directional change in EUR/USD’s near-term future. While the bullish theme has appeared to re-enter the equation over the past few weeks, buyers have been reticent around resistance: And after the 1.2000 inflection that showed in the pair in early-September, the question remains for how much higher on the chart might buyers be able to drive?

Incorporating the fundamental side of the equation: The ECB doesn’t look to be in a hurry for another round of intervention; and as highlighted by our own David Song, it looks as though the bank may be ready to sit aside whilst reviewing data before making that next nudge to monetary policy.
On the data front – the big item on the docket this week is Euro inflation numbers, set to be released on Friday. For next major levels on the chart – potential support exists around the 1.1695 area, after which a zone running from 1.1600-1.1625 becomes of interest. On the resistance side of the coin, 1.1775 looms large, followed by the current October high around 1.1831.
EUR/USD Four-Hour Price Chart
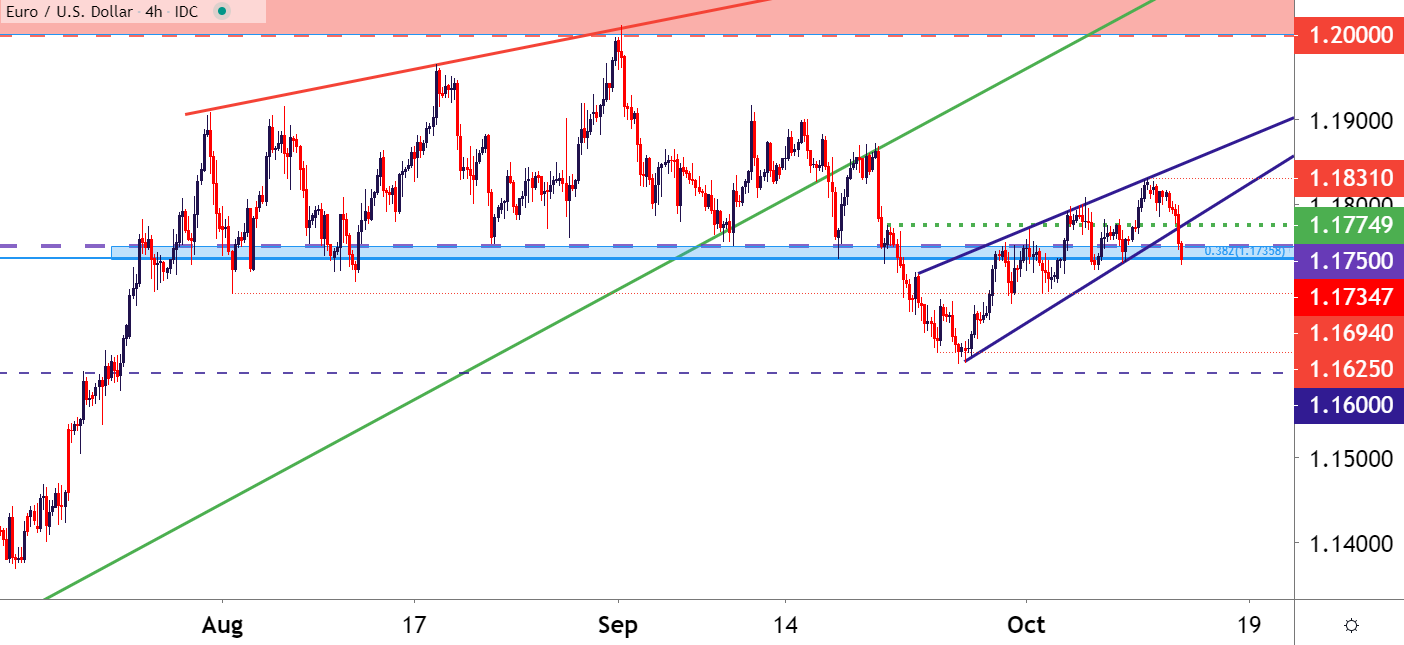
Chart prepared by James Stanley; EUR/USD on Tradingview
--- Written by James Stanley, Strategist for DailyFX.com
Contact and follow James on Twitter: @JStanleyFX


