


Woodies pivot points provide a unique approach to calculating key levels of short-term support and resistance and are popular among intraday and day traders alike. Trading Woodies pivot points may be similar to other pivot point variations, however, understanding the subtle differences inherent to Woodies pivot points is key to developing a trading edge.
Read further to learn more about:
- Definition of Woodies pivot points
- Calculation method
- Trading with Woodies pivot points
- Advantages and Limitations
What are Woodies pivot points?
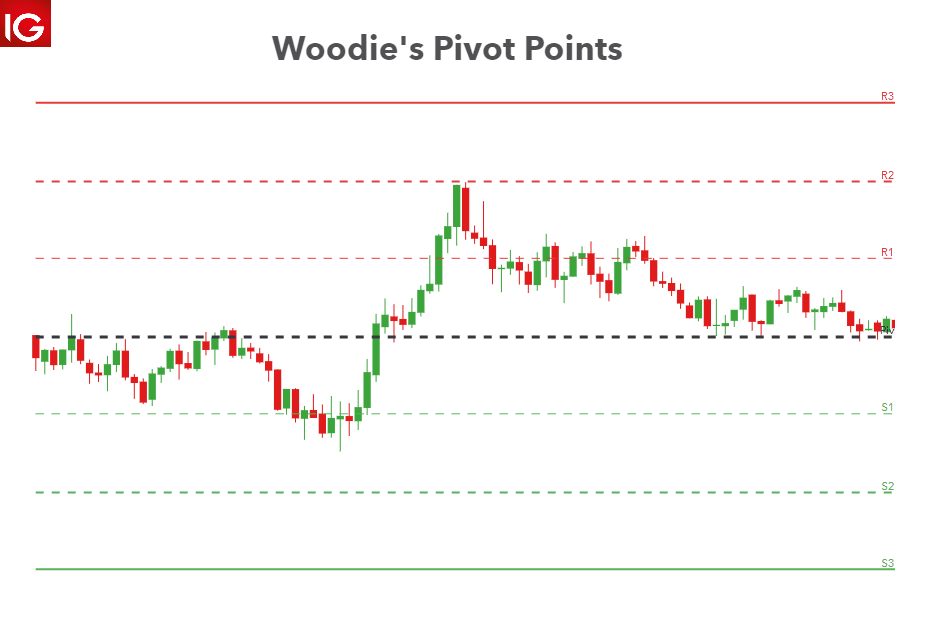
Woodie’s pivot points are made up of multiple key levels, calculated from past price points, in order to frame trades in a simplistic manner. The key levels include the ‘pivot’ itself, and multiple support and resistance levels (usually up to three each). Traders use these levels as a guide for future price movements when setting up trades.
How to calculate Woodie’s pivot points
The calculation of Woodie’s pivot points may seem complex at first but is actually quite simple. Furthermore, DailyFX has a dedicated pivot points page for Woodie’s, Camarilla and floor-traded pivot points.
The calculation for Woodie’s pivot points differs from other pivots because it places a greater weighting on recent price data than other variations. It is widely believed that the high and low prices are a result of emotions in the heat of the battle, while the opening and closing prices are a more accurate representation of the mood of the market.
The pivot: (Previous high + previous low + 2 x previous close) / 4
| Pivot location relative to price | Direction bias |
|---|---|
| Price above pivot | Bullish bias |
| Price below pivot | Bearish bias |
R1: (2 x pivot) – previous low
R2: Pivot + high - low
R3: High + 2 x (Pivot – low)
S1: (2 x pivot) – Previous high
S2: Current pivot – (R1 – S1)
S3: Low – 2 x (High – pivot)
The calculation of Woodie’s pivot points is also similar to the exponential moving average (EMA) in that it too assigns greater weight to the calculation. This is in stark contrast to the simple moving average (SMA).
In essence, assigning greater weighting to recent price points makes the indicator more dynamic as it is able to process and display recent information faster.
Trading with Woodies pivot points: Top strategies
Woodies pivot based trading strategies are generally shorter, intraday strategies using smaller forex time frames. As such, traders can use the daily pivot points to frame current price action and observe smaller time frame charts, such as 15-minute charts, for entries, exits and risk management.
Intraday range trading strategy using Woodies pivot points
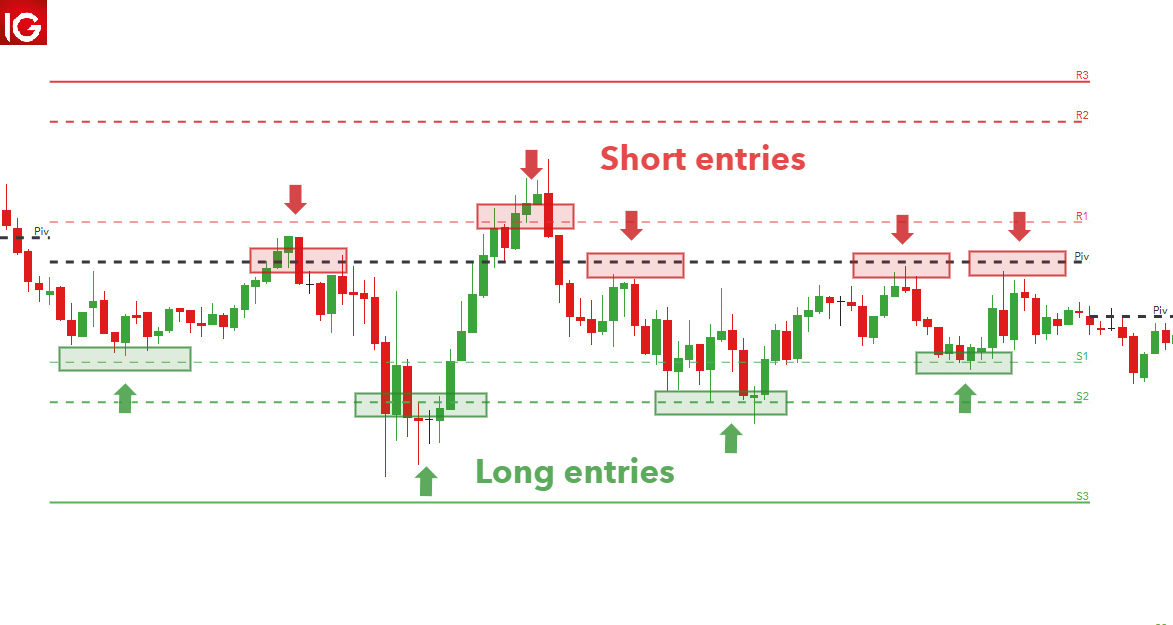
With shorter time frames, Woodie’s pivots often create zones/ranges where price tends to trade more often than not. Traders looking to take advantage of price moving within a range will look to buy at the bottom of the range and sell at the top of the range.
In the EUR/USD chart below, there are multiple opportunities to enter short or long. For long trades, price bounces off S1 and S2 rather frequently and traders can target the pivot as a take profit level while setting stops at the next lower support level.
Similarly, for short trades, bounces off R1 and the pivot itself can be identified as entry points while targeting S1 and S2. Stops can be placed at R1 or R2 respectively.
However, since price started the day trading below the pivot, it is prudent to keep a short bias unless proven otherwise. So, while traders may take both sides of this range trading opportunity, a higher probability of success can be placed on short trades.
Momentum Breakout Strategy
This strategy aims to latch onto a sharp, sudden move in price using key levels as support and resistance.
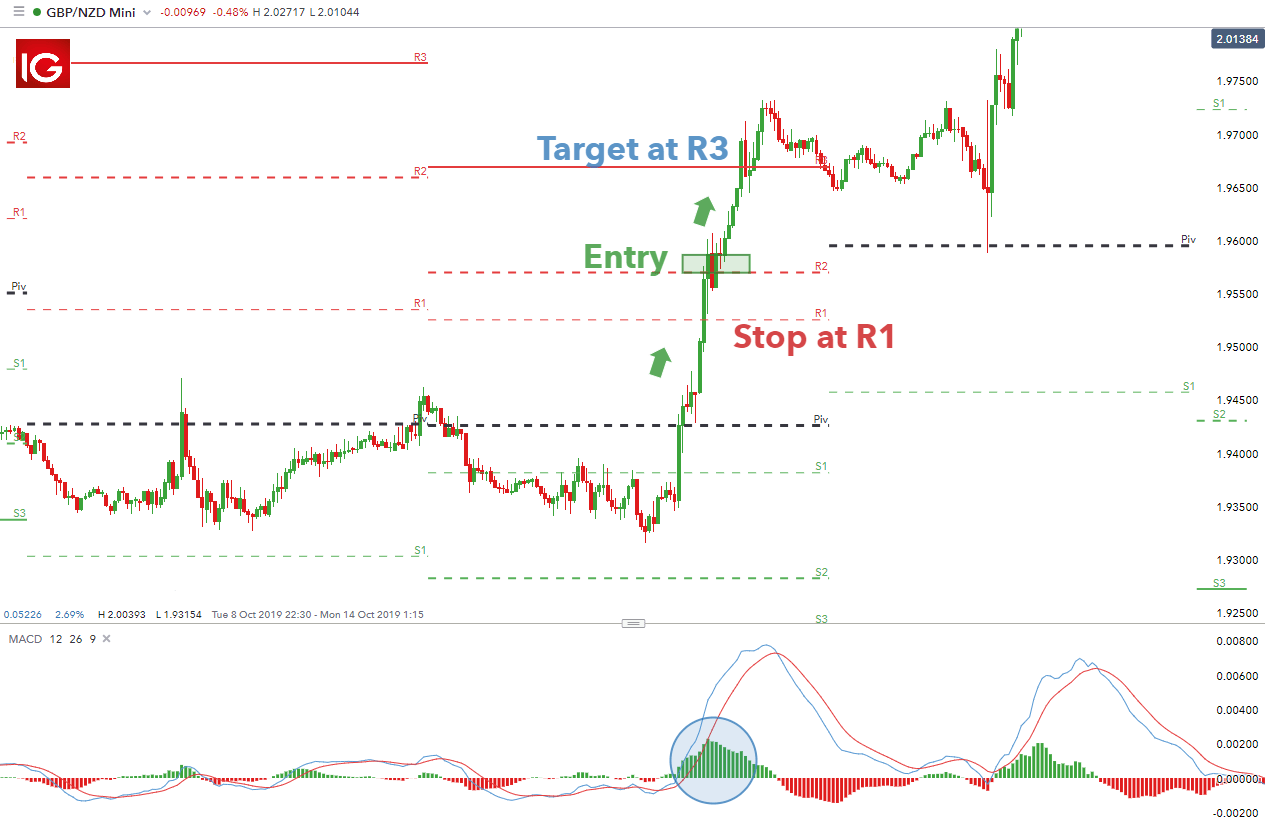
The GBP/NZD chart below presents such a scenario, as price breaks out of its usual trading range with increased momentum – confirmed by the green histograms on the MACD indicator.
Price had previously traded below the pivot point until the sharp move up. At this point, traders would be watching if price respects the R1 level as they could eye a short (mean-reversion) trade back down to the pivot.
After price passed through R1 with ease, traders would naturally lean away from any short bias and would start to prepare for a long trade in the event price traded above R2.
A suitable entry would be just above R2 with a conservative stop loss being placed at R1 in the event of a failed move higher. R3 presents a suitable target and ensure a positive risk to reward ratio is achieved.
Advantages and limitations of trading with Woodies pivot points
Woodies pivot points, although based around the classical ‘Floor-Traded Pivot’, have some distinct advantages and limitations. These are tabled below:
| Advantages of Woodies pivot points | Limitations of Woodies pivot points |
|---|---|
| Applies greater weighting (importance) on recent price levels | May not be ideal for longer-term traders |
| Beneficial for short-term traders | Novice traders may be intimidated by the many formulas and lines on charts |
| Improves traders risk management |
Further reading on pivot points
- For an in-depth look at pivot points and how to use them in forex trading, read our article on pivot point strategies for forex traders.
- Whether you prefer Camarilla, Woodie or Classical pivot points, we have you covered with our up to date pivot points page.
- The central concept around pivot points is that of support and resistance. Learn the ins and outs of this concept through our guide to support and resistance trading.