


The Camarilla pivot point is a versatile indicator that allows traders to recognize key price levels, entry points, exit points and appropriate risk management. The best Camarilla pivot trading strategy is dependent on the market conditions at a given time. These market conditions will dictate the most appropriate Camarilla strategy to employ. There are various Camarilla pivot point strategies to trade any financial market. This article will cover the following foundational concepts:
- Definition of a Camarilla pivot point
- Camarilla trading strategies
- Advantages and limitations of trading with camarilla pivot points

What is a Camarilla pivot point?
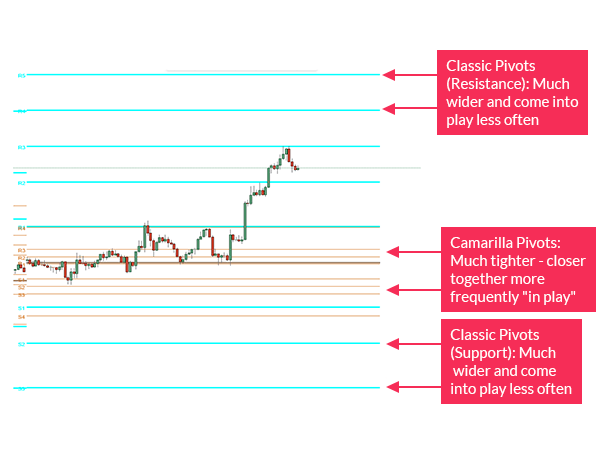
A Camarilla pivot point is an extension of the classical/floor trader pivot point which provides traders with key support and resistance levels. There are four support and four resistance levels included in the Camarilla pivot, as well as considerably closer levels than other pivot variations – see image below. This proximity makes the Camarilla ideal for short-term traders.
Proximity of Camarilla pivot points vs Classic pivot points
Follow our hourly, daily, weekly and monthly Camarilla pivot points through our DailyFX pivot page pivot points to determine market sentiment.
Camarilla equation formula
The calculation for Camarilla pivot points along with its support and resistance levels:
Fourth resistance (R4) = Closing + ((High -Low) x 1.5000)
Third resistance (R3) = Closing + ((High -Low) x 1.2500)
Second resistance (R2) = Closing + ((High -Low) x 1.1666)
First resistance (R1) = Closing + ((High -Low x 1.0833)
Pivot point (PP) = (High + Low + Closing) / 3
First support (S1) = Closing – ((High -Low) x 1.0833)
Second support (S2) = Closing – ((High -Low) x 1.1666)
Third support (S3) = Closing – ((High -Low) x 1.2500)
Fourth support (S4) = Closing – ((High-Low) x 1.5000)
2 Camarilla pivot trading strategies
There are several Camarilla pivot point strategy techniques. Below are three favored approaches used by traders using this handy indicator.
1) Camarilla pivot range strategy
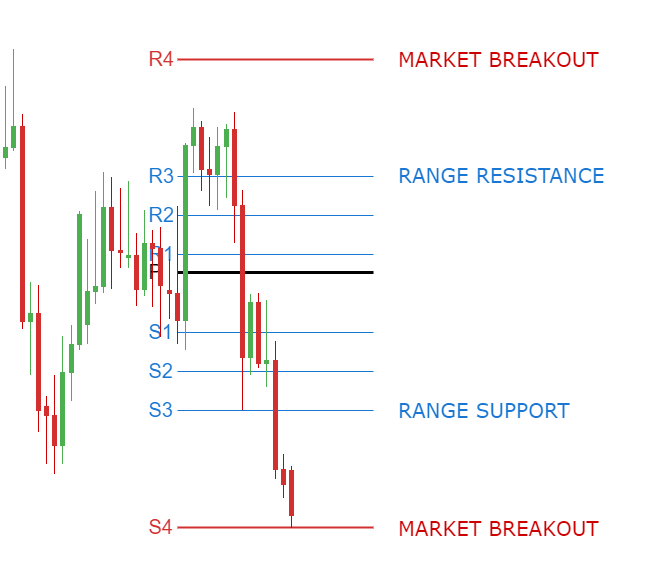
A range is known as a sideways market with price trading in between established lines of support and resistance. Range traders can benefit greatly from Camarilla pivots, as each day the indicator will offer a new range for trading. As seen below traders looking for short term range reversals should primarily focus on price moving between the S3 and R3 pivots. This area is known as the daily trading range and can allow range traders clear areas to plan their market entries.
Traditionally, range reversal traders will look for price to move toward either a point of support or resistance. If resistance holds range traders will look to initiate short positions near the R3 pivot, with the intent of price moving to support. Conversely, if price remains supported above the S3 Camarilla pivot, range traders will look to initiate buy based positions near the S3 pivot with the intent of price moving back towards the R3 resistance pivot. However, it should be noted that price can stay range bound throughout the day.
This strategy works best in low volatility periods such as the Asian trading session. In more volatile times, traders will look to move away from this strategy to something more inclusive of erratic price movements – see strategy 2 below.
Typical Camarilla pivot setup
2) Camarilla pivot trend strategy
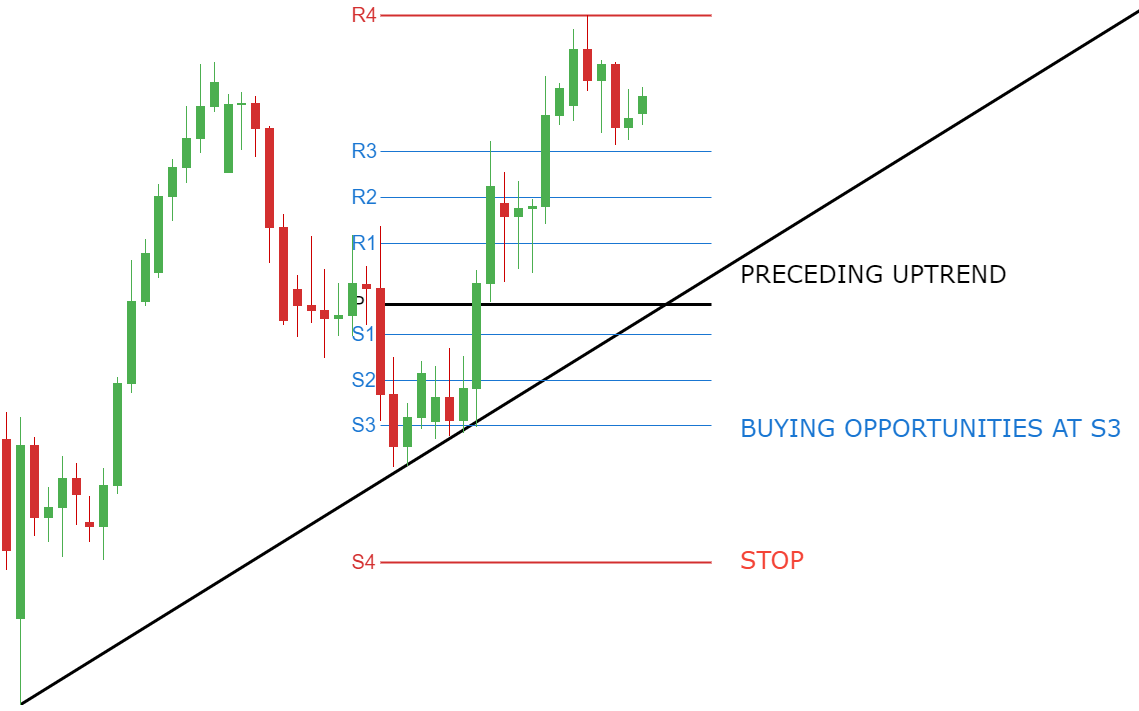
A trend is a strong directional move that pushes price either higher or lower over a specified period of time. The Camarilla pivot can be extremely useful during trending markets, and provide traders with key entry, stop and limit levels. Traders will look to filter entries in the direction of the trend. If the market is trending up, look for buying opportunities at the S3, stop at S4. If the market is trending down, sell R3 and stop at R4.
The chart below shows an AUD/JPY chart in an uptrend. With this in mind, traders will be looking for long entries at S3 with stops at S4 as indicated. There are various methods to identify take profit levels such as Fibonacci extensions/retracements, price action or other technical indicators. This decision is at the discretion of the individual trader.
Advantages and limitations of trading with camarilla pivot points
| Advantages of Camarilla Pivot Points | Limitations of Camarilla Pivot Points |
|---|---|
| Beneficial for short-term traders | May not be ideal for longer-term traders |
| Improves traders risk management | Can be difficult to implement for novice traders |
| Works well in all financial markets | Applying the wrong strategy to the wrong market condition can lead to additional losses |
Further reading on pivot points
- Broaden your understanding of the classical/floor trader pivot point for a solid foundation, or read our guide to trading forex with pivot points for a generic overview
- We also recommend learning about another variation of the pivot: the Woodies pivot point