


US dollar Vs Euro, British Pound, Japanese Yen – Price Setups:
- The US dollar looks set to gain further.
- Economic momentum and Fed hawkishness to support USD.
- What is the outlook on EUR/USD, GBP/USD, and USD/JPY?

The US dollar looks set to gain further against some of its peers on relative outperformance of the US economy and monetary policy edge. In his semi-annual testimony to lawmakers, US Federal Reserve Chair Jerome Powell stepped up hawkishness, saying the ultimate rate peak likely to be higher than expected and the central bank is prepared to increase the pace of rate hikes if needed.
As a result, odds of a 50-bps rate hike at the March 21-22 FOMC meeting have increased, with US rate futures now pricing in a terminal fed funds rate at 5.63% by September from 5.48% before Powell’s testimony, and 5% at the end of January, close to 100 bps higher than the current Fed policy rate of 4.50%-4.75%.
EUR/USD Daily Chart
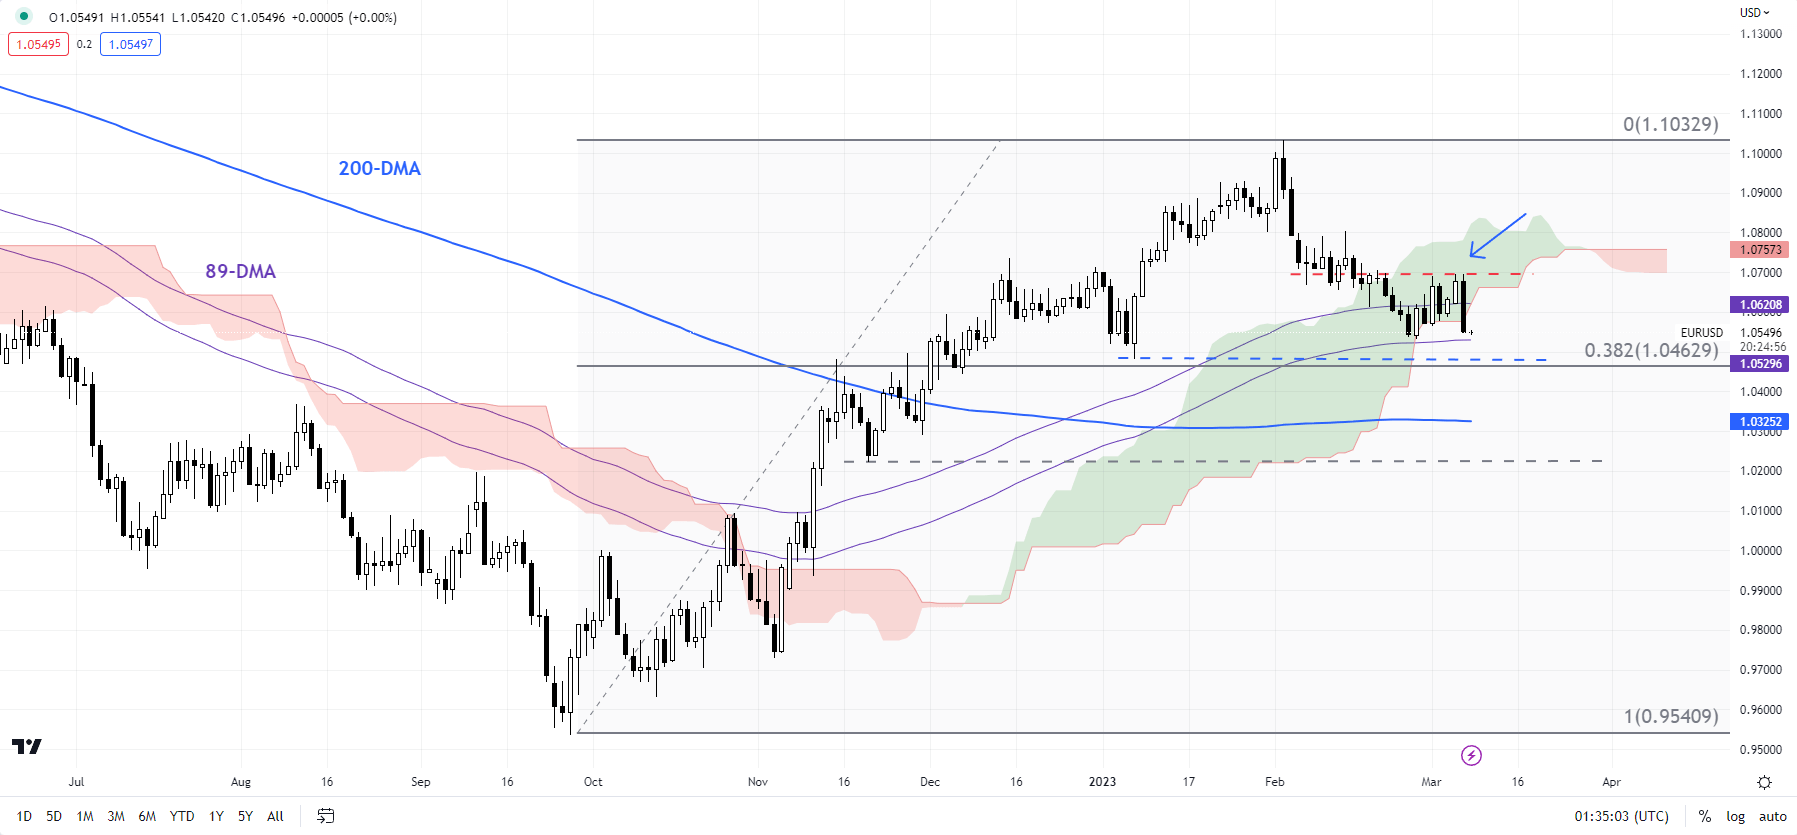
Chart Created Using TradingView
In contrast, other central banks, with the exclusion of the European Central Bank, appear to be turning less hawkish. The market pricing in the Reserve Bank of Australia’s terminal cash rate at 4.03% by August from 3.60% now; just one rate hike by the Bank of Canada to take the policy rate to 4.74% by July from 4.5% now; over 3 rate hikes by the Bank of England to take the terminal policy rate to 4.87% by September from 4% currently; and just one Bank of Japan rate hike by September. However, the market expects the European Central Bank to take its policy rate to 4.24% by early 2024 from 2.5% now.
Moreover, economic momentum since the beginning of February has been in favor of the US, with the US Economic Surprise Index around 10-month highs. In contrast, data in recent weeks have come in below expectations for its peers or just beginning to improve (UK). The exception is Japan where the Economic Surprise Index is at its highest level since mid-2021.
EUR/USD 240-minute Chart
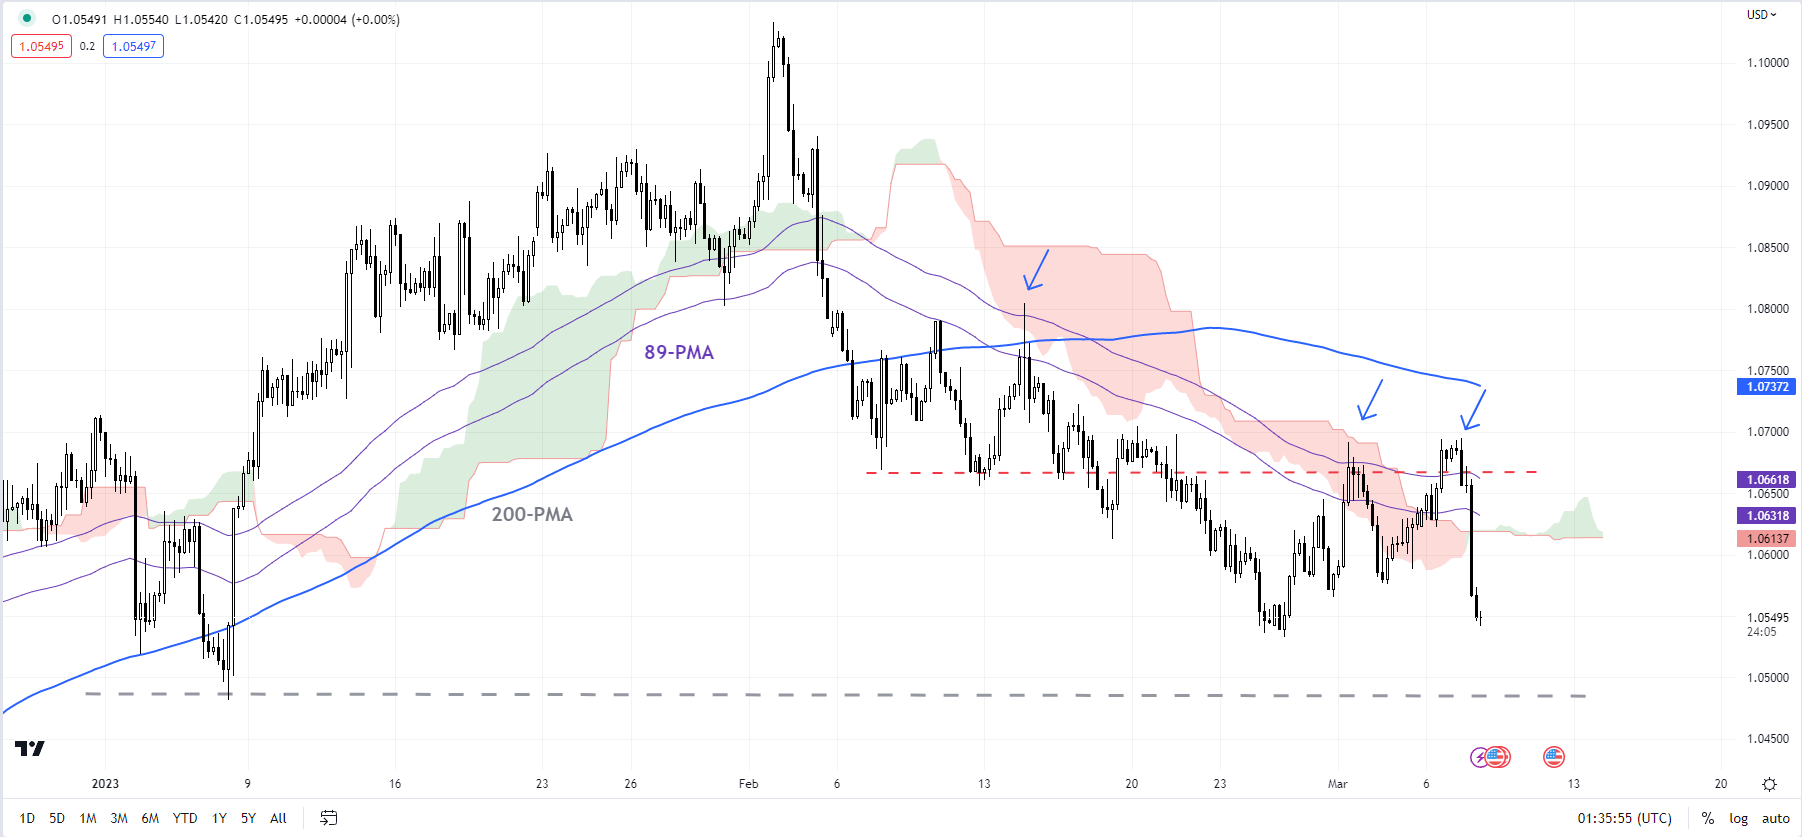
Chart Created Using TradingView
EUR/USD – Approaching crucial support
Despite the sharp fall overnight, EUR/USD continues to hold above a vital converged cushion at the January low of 1.0480, coinciding with the 89-day moving average. This support is crucial and any break below would terminate the higher-top-higher-bottom sequence since September, initially exposing the downside toward the 200-day moving average (now at 1.0325). Subsequent support is at the late-November low of 1.0221. On the upside, EUR/USD would need to clear a tough barrier at 1.0650-1.0700 for the immediate downward pressure to fade.
GBP/USD Daily Chart
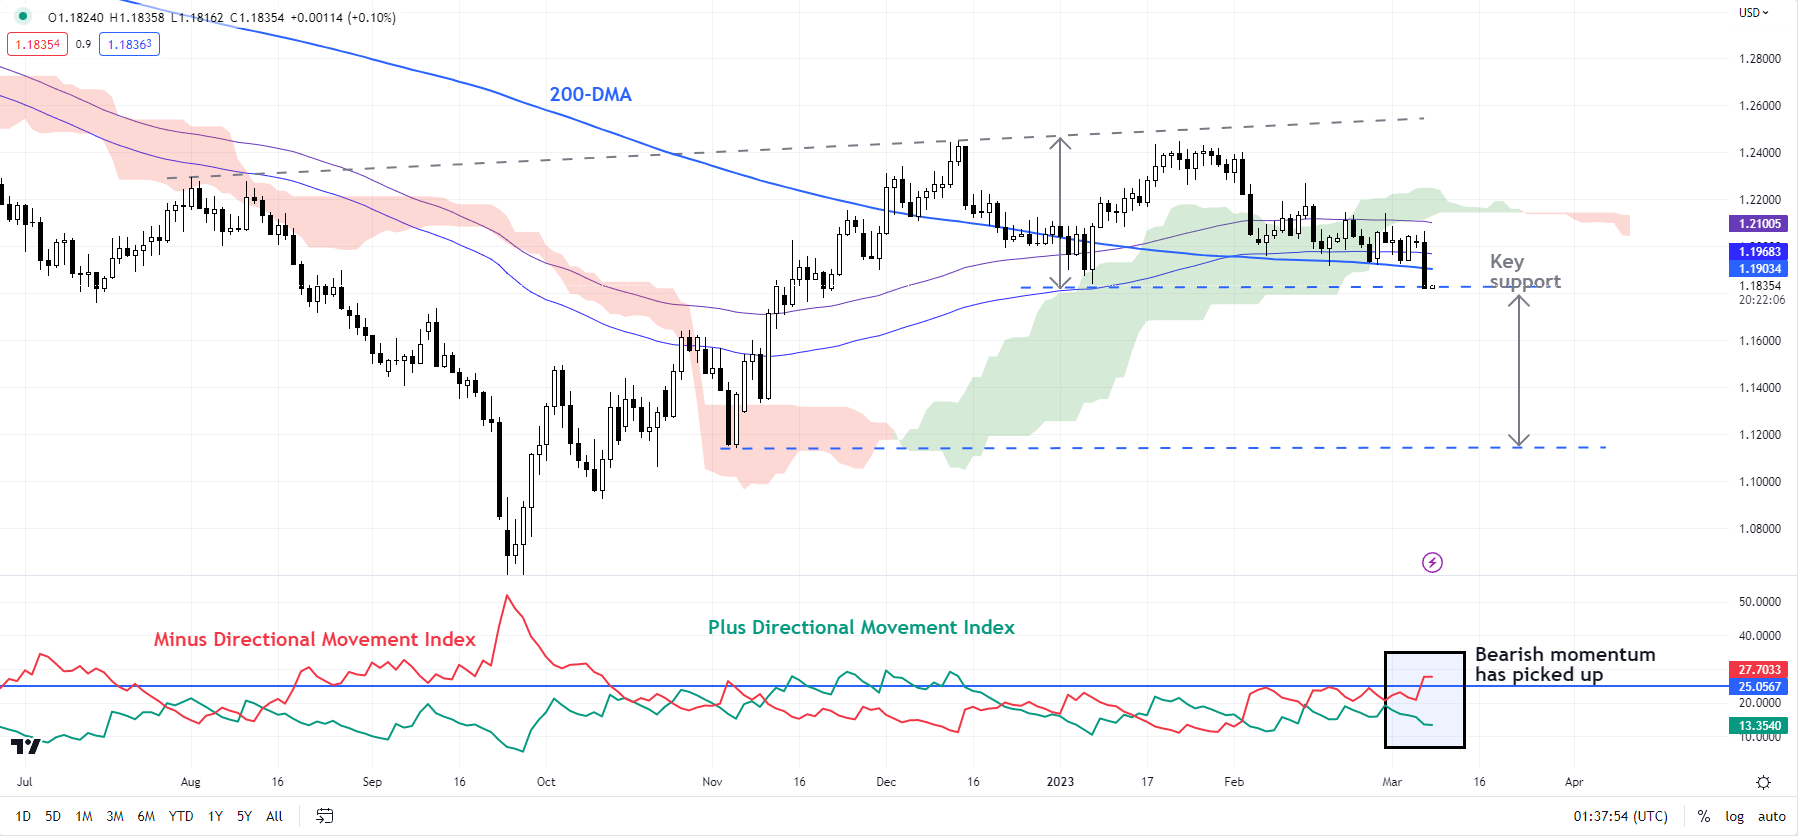
Chart Created Using TradingView
GBP/USD – Risks a double top
GBP/USD looks vulnerable as it attempts to fall below key converged support of around 1.1840, including the early-January low, the 89-day moving average, and the 200-day moving average. As highlighted in the previous update, a decisive break below would trigger a minor double top (the December and January highs), potentially opening the way toward 1.1250. Also, it would raise the odds that the uptrend since September had terminated. On the upside, at minimum, GBP/USD needs to clear the 89-period moving average on the 240-minute charts for the immediate weakness to begin easing.
GBP/USD 240-minute Chart
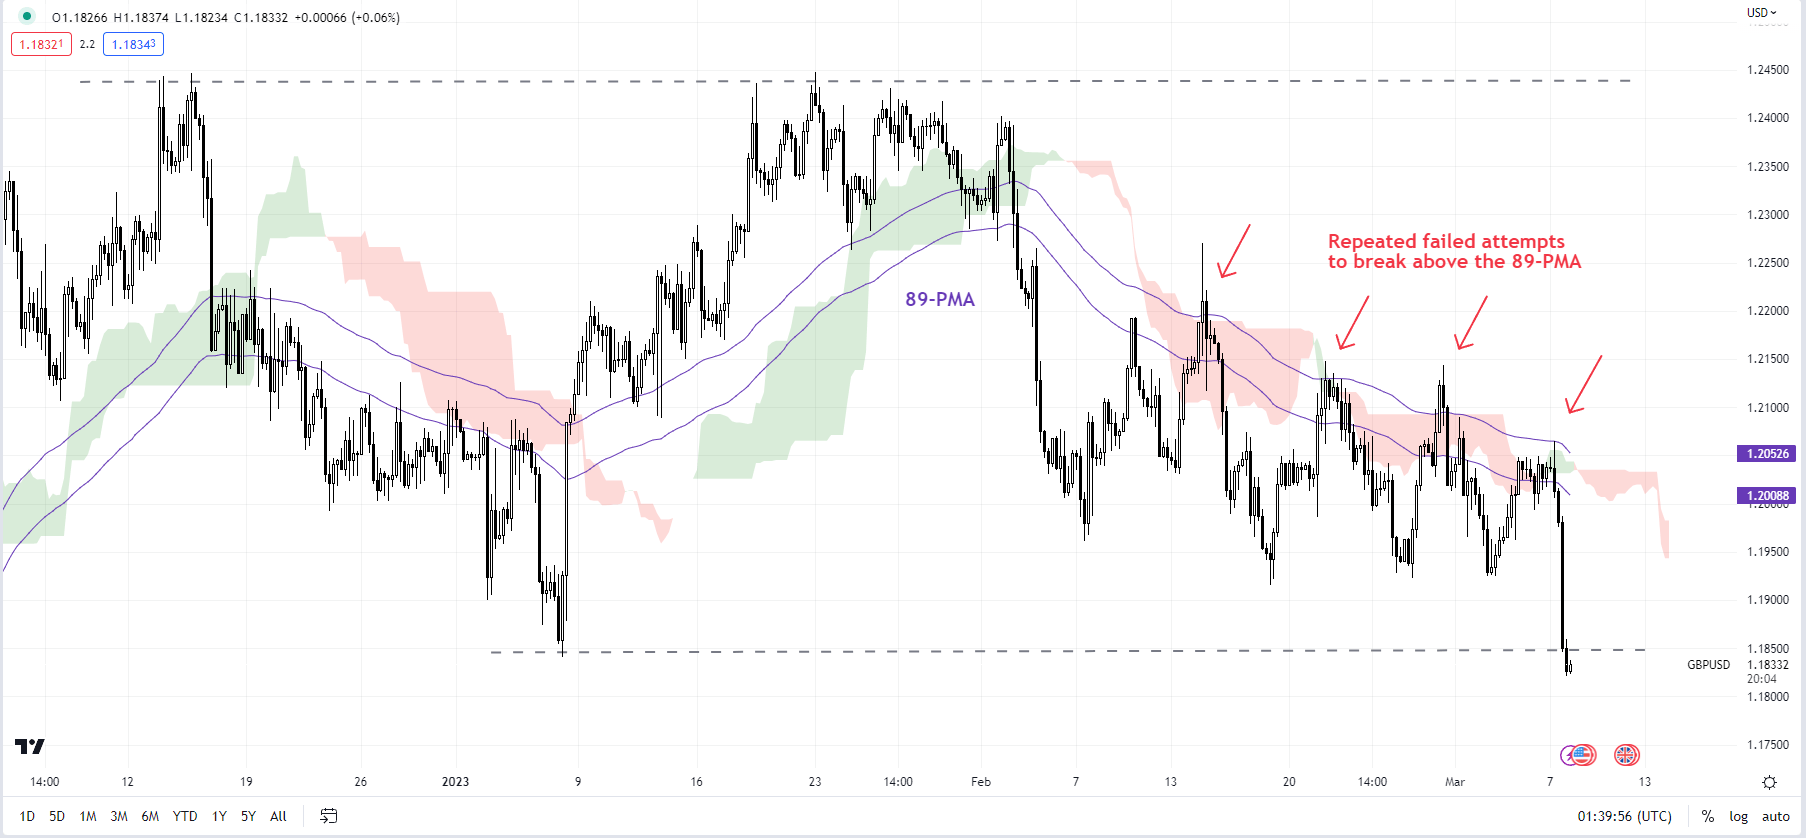
Chart Created Using TradingView
USD/JPY – Flirts with stiff resistance
USD/JPY has been flirting with stiff resistance on the 200-day moving average (at about 137.50), near the December high of 138.20. Momentum, though up, has flattened in recent days, potentially a sign of fatigue – see the 14-day Relative Strength Index on the daily chart. However, unless the USD/JPY breaks below immediate support at the March 1 low of 135.25, the imminent upward pressure is unlikely to fade. A decisive break above 137.50-138.20 could open the door toward the late-November high of 142.25.
USD/JPY Daily Chart
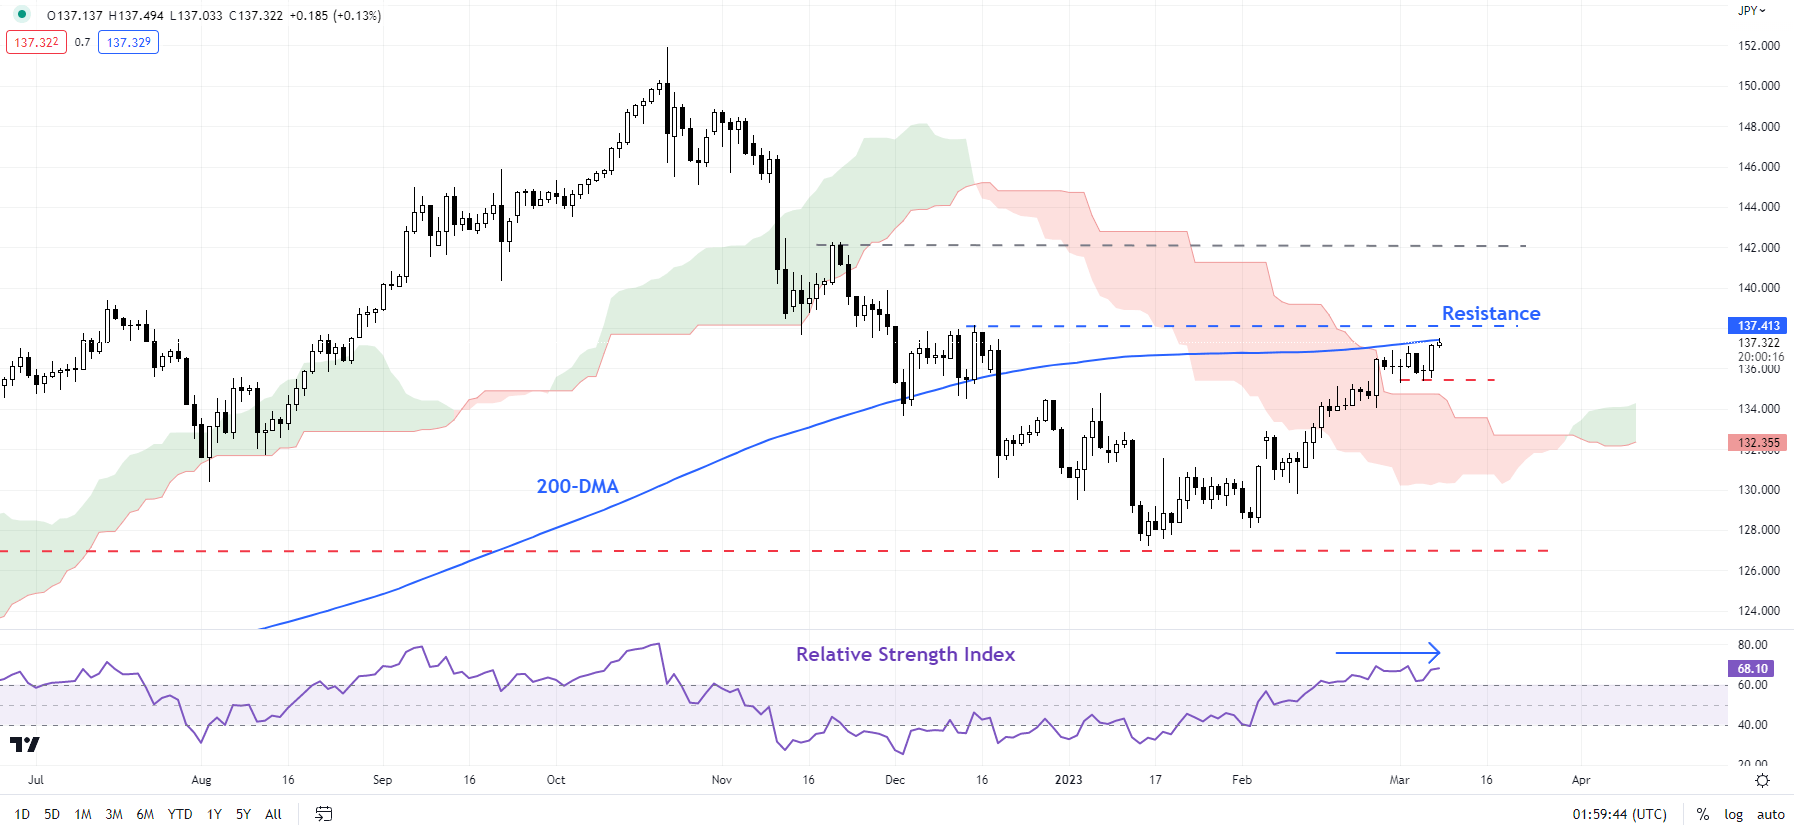
Chart Created Using TradingView
Trade Smarter - Sign up for the DailyFX Newsletter
Receive timely and compelling market commentary from the DailyFX team
--- Written by Manish Jaradi, Strategist for DailyFX.com


