


US dollar Vs Euro, Australian Dollar, British Pound – Price Action Setups:
- The US dollar is holding firm against its peers.
- Despite the re-rating higher of US Fed rate hike expectations, the five-month-long US dollar downtrend hasn’t reversed yet.
- What is the outlook on EUR/USD, GBP/USD and AUD/USD?

The US dollar is holding firm against its peers on solidifying expectations of an extended US interest rate hiking cycle. US economic data have broadly beaten expectations since the start of February, triggering a re-rating of US Fed rate hike expectations. Rate futures are now pricing in the Fed’s target rate to peak around 5.5% in September from the current 4.50-4.75%, compared with under 5% at the end of January.
US dollar index (DXY index) – Yet to clear vital resistance
Despite the strength of US data recently and the dramatic repricing higher of Fed rate expectations (rate cuts expectations for this year are nearly priced out), the US dollar index hasn’t made any fresh inroads. That is, the DXY index has held crucial support at the June low of 101.30 but hasn’t broken any significant resistance on the daily charts. The index is now testing a vital converged 105.50-106.50 ceiling: the early-January high of 105.65, the 200-day moving average, coinciding with the upper edge of the Ichimoku cloud on the daily charts.
US dollar index (DXY index) Daily Chart
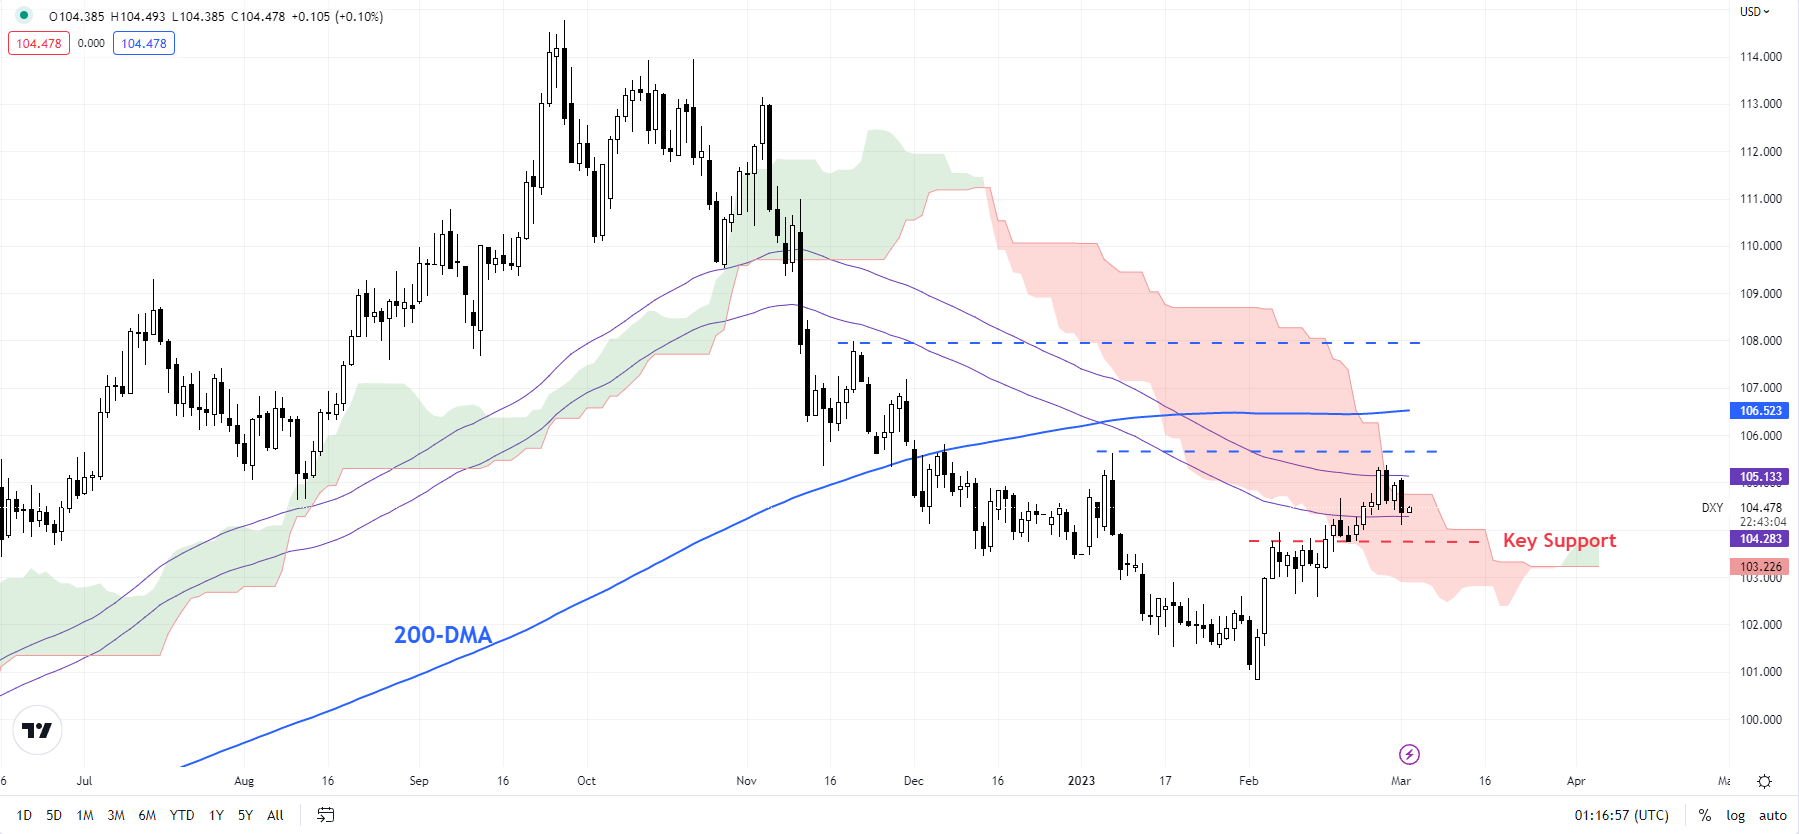
Chart Created Using TradingView
Any break above the 105.50-106.50 area would disrupt the lower-bottom-lower-top formation since late 2022, posing a risk to the weak US dollar (USD) outlook. Any break above the late-November high of 108.00 would require a reassessment of the multi-week bearish outlook. On the downside, any break below immediate support on a horizontal trendline from early February at about 103.75 would raise the odds of a resumption of the USD weakness.
EUR/USD – Holding above key support
EUR/USD has been holding a crucial converged floor at the January low of 1.0480, coinciding with the 89-day moving average. The single currency has attempted to rebound this week, but so far hasn’t managed to clear a stiff resistance on a horizontal trendline from early February at about 1.0700. A break above the barrier is needed to raise the chances of an extension of the uptrend. On the downside, any break below the January low of 1.0480 would pose a risk to the five-month-long uptrend, exposing the downside toward the 200-day moving average (now at 1.0330).
EUR/USD Daily Chart
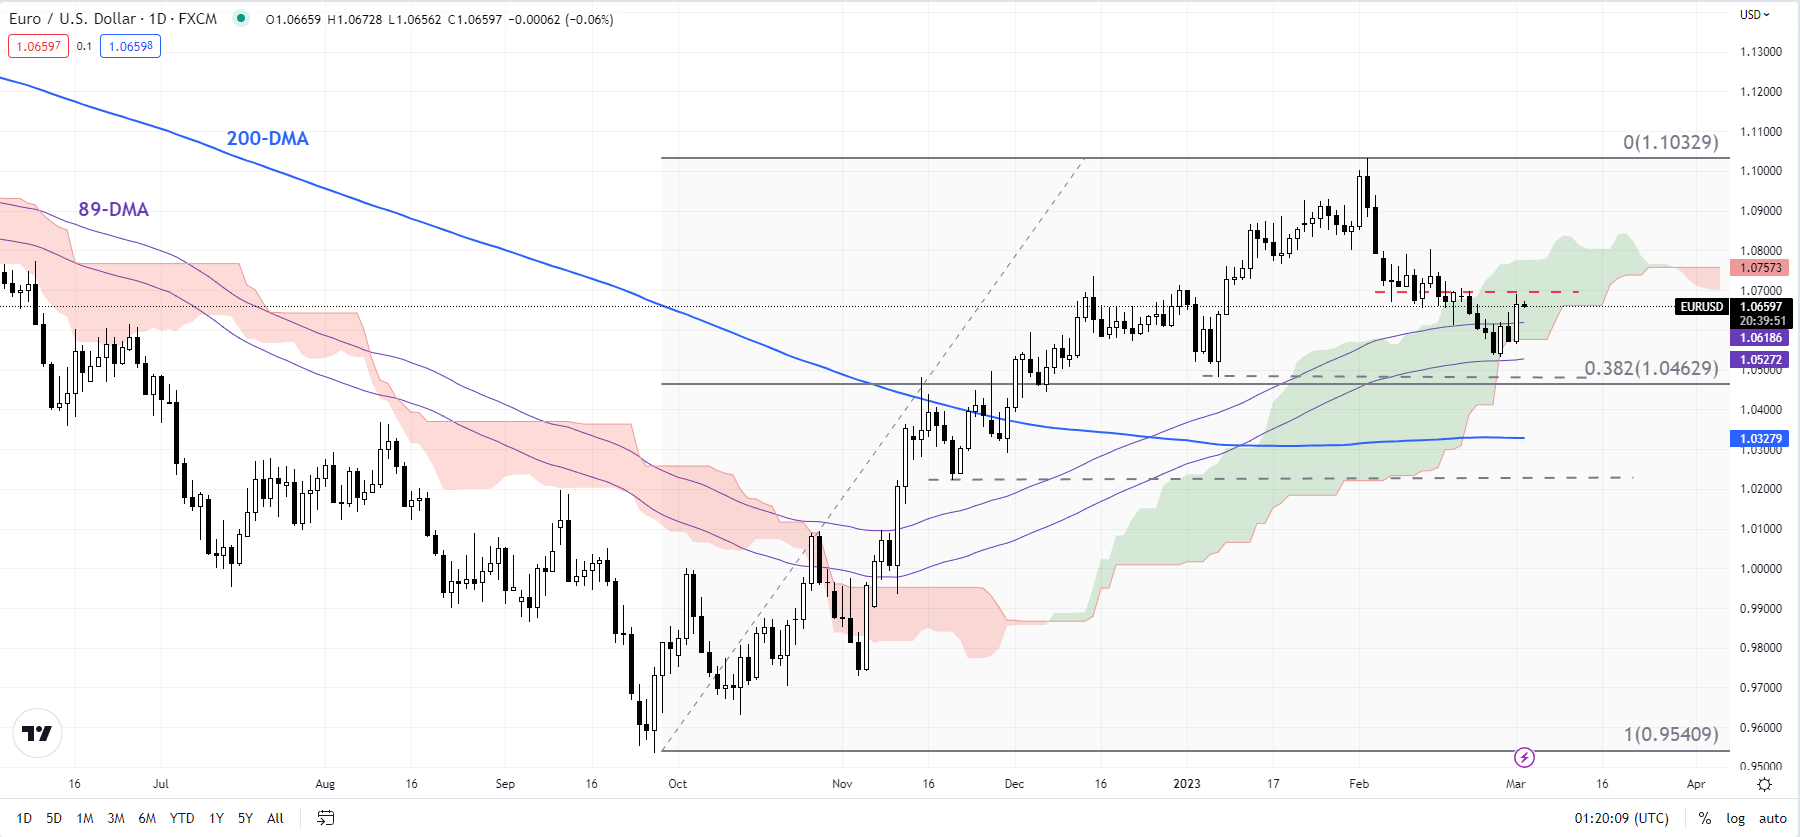
Chart Created Using TradingView
GBP/USD – Flirts with 200-day moving average
In recent weeks, GBP/USD has been flirting with a fairly strong converged support of around 1.1840, including the early-January low, the 89-day moving average and the 200-day moving average, and the lower edge of the Ichimoku cloud support. Any break below would trigger a minor double top (the December and January highs), potentially opening the way toward 1.1250. More importantly, such a break would disrupt the higher-top-higher-bottom pattern formed since September, posing a risk to the recovery trajectory since September.
GBP/USD Daily Chart
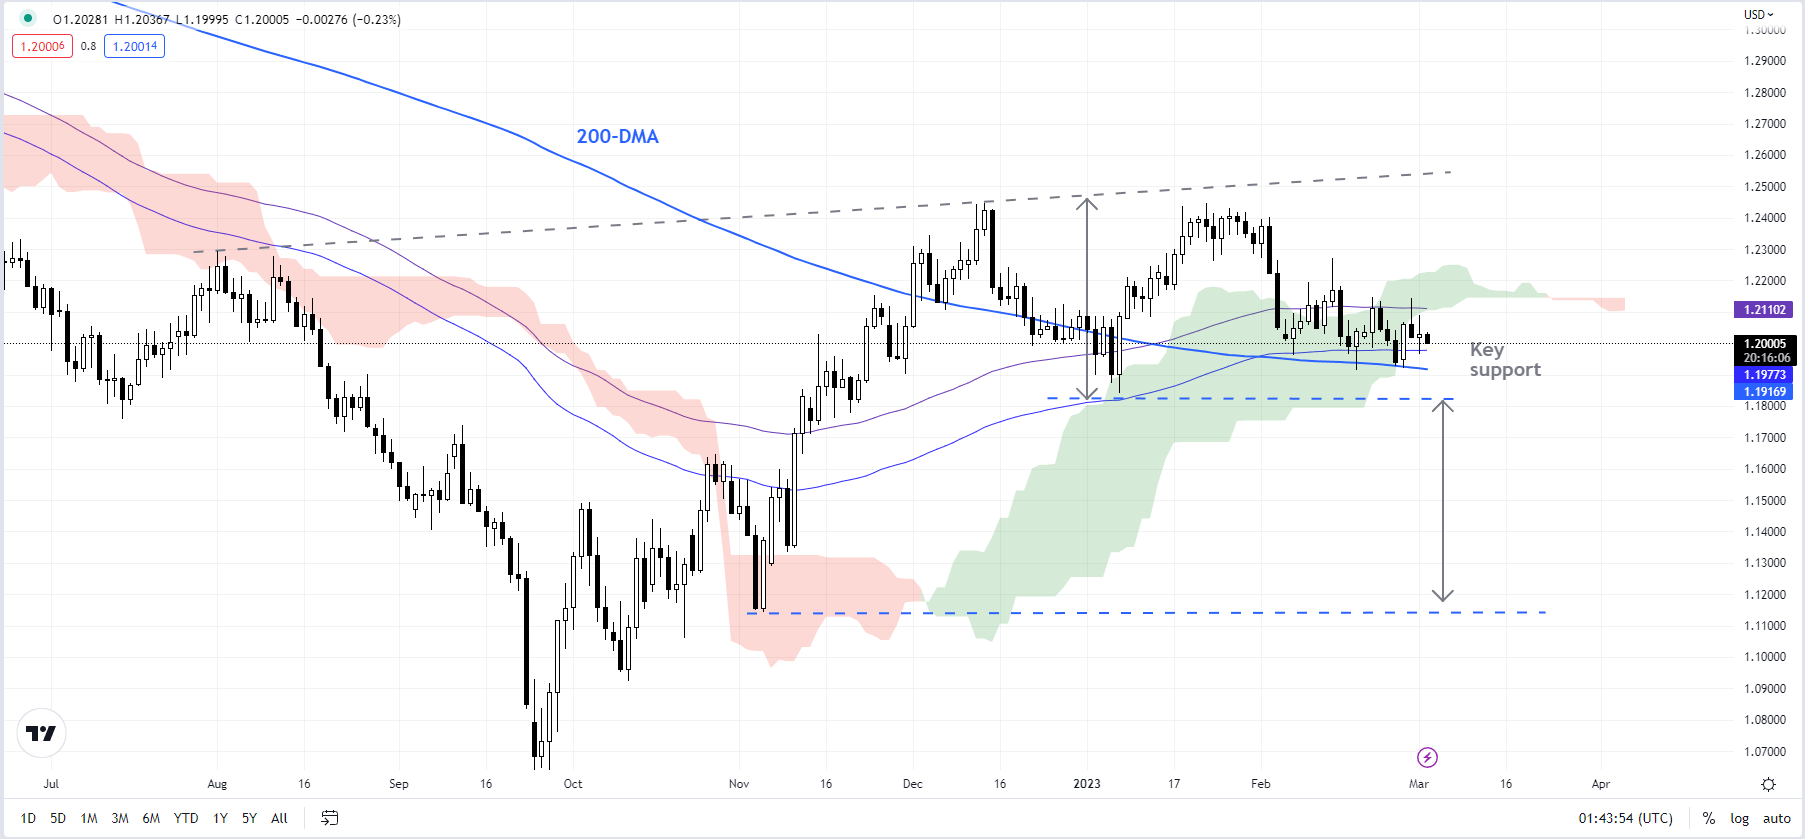
Chart Created Using TradingView
AUD/USD – Weighed by the head & shoulders pattern
AUD/USD’s rebound following Wednesday’s China manufacturing data beat appears to be running out of steam as it nears the support-turned-resistance on the 200-day moving average. The lack of follow-through could be partly because the fall in late February below significant support on a horizontal trendline from mid-January at 0.6870 triggered a minor head & shoulders pattern (the left shoulder is the January 18 high, the head is the February 2 high, and the right shoulder is the February 14 high) with a price objective of 0.6580. AUD/USD is now nearing quite a strong cushion at the late-November low of 0.6585 – the pair needs to hold above the support for the four-month-long uptrend to remain intact
AUD/USD Daily Chart
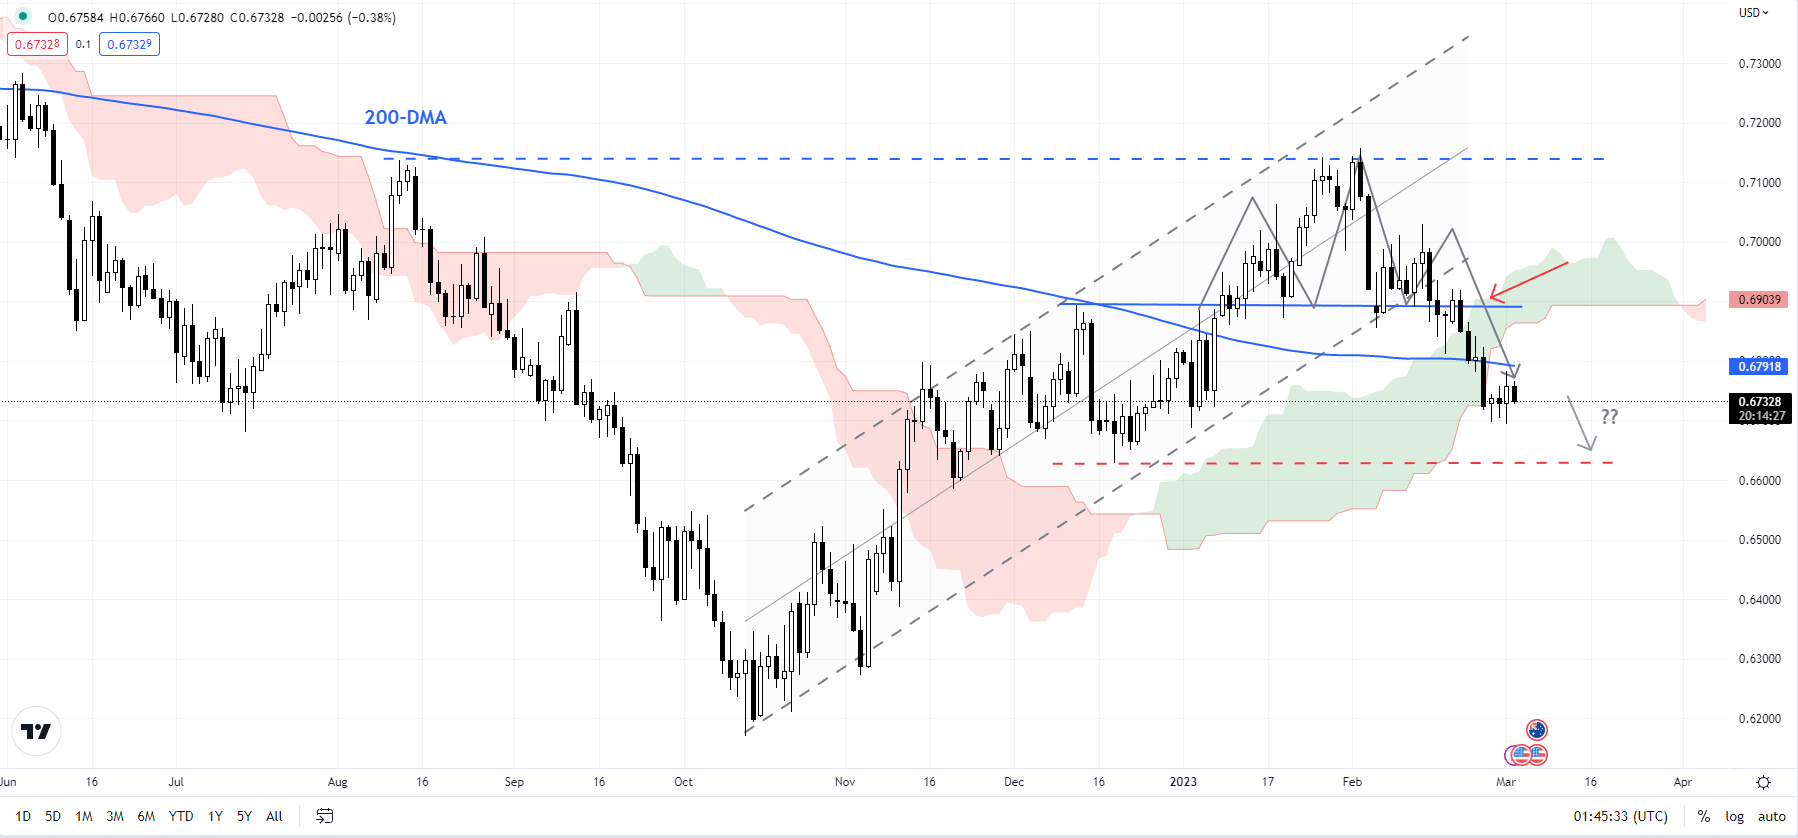
Chart Created Using TradingView
Trade Smarter - Sign up for the DailyFX Newsletter
Receive timely and compelling market commentary from the DailyFX team
--- Written by Manish Jaradi, Strategist for DailyFX.com


