


SGD, Singapore dollar, USD/SGD - Technical Outlook:
- USD/SGD’s downward momentum has accelerated recently.
- USD/SGD is approaching a strong support area.
- What is the outlook and the key levels to watch?

USD/SGD TECHNICAL FORECAST - BEARISH
Upward momentum in the Singapore dollar has accelerated against the US dollar in recent weeks, raising the prospect of further gains in the coming months. However, deeply overbought conditions point to a pause in the Asian currency’s rally.
USD/SGD is down nearly 10% since September and has seen consecutive losses on a monthly basis since October. The Relative Strength Index (RSI) on the daily and weekly charts is below 25, not only reflecting oversold conditions but also how strong the downward momentum has been in recent months. This column firsthighlighted in mid-November that the worst could be over for the Singapore dollarand apotential move toward 1.3150 in December.
USD/SGD Weekly Chart
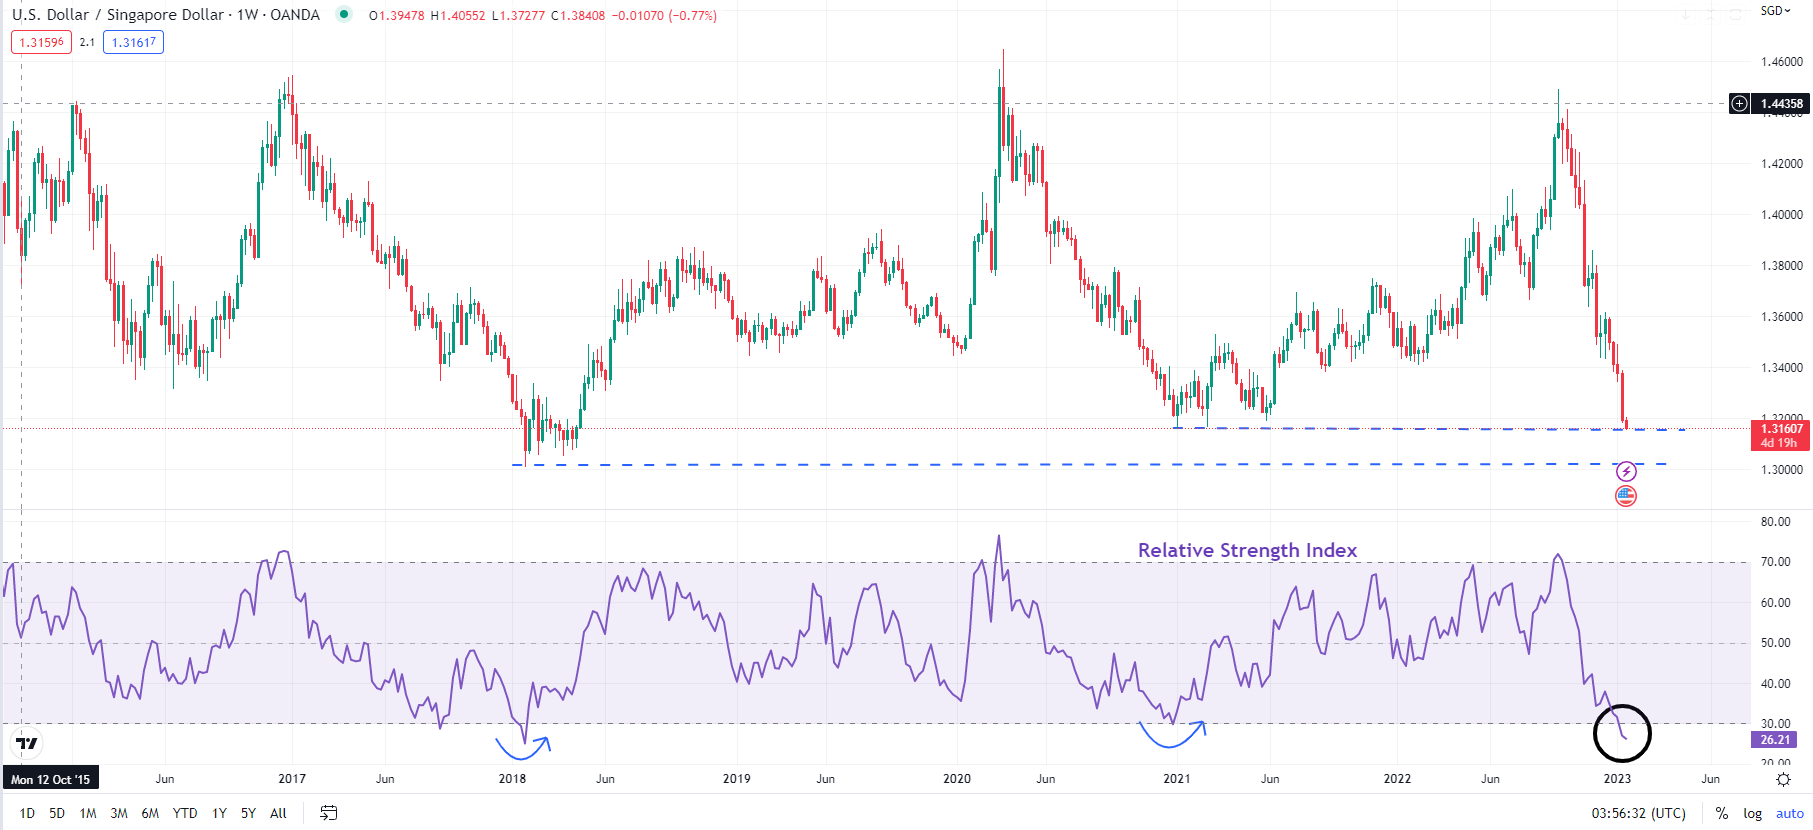
Chart Created Using TradingView
USD/SGD is now approaching a key cushion on the lower edge of the channel is a horizontal trendline from 2015 (at about 1.3150), slightly above the 2018 low of 1.3000. Given the pace and the extent of the fall from late 2022, it wouldn’t be surprising to see some sort of a consolidation/minor rebound, especially given deeply oversold conditions. As the weekly chart shows, the previous rebounds in 2018 and 2021 were associated with the 14-week RSI below 30.
USD/SGD Daily Chart
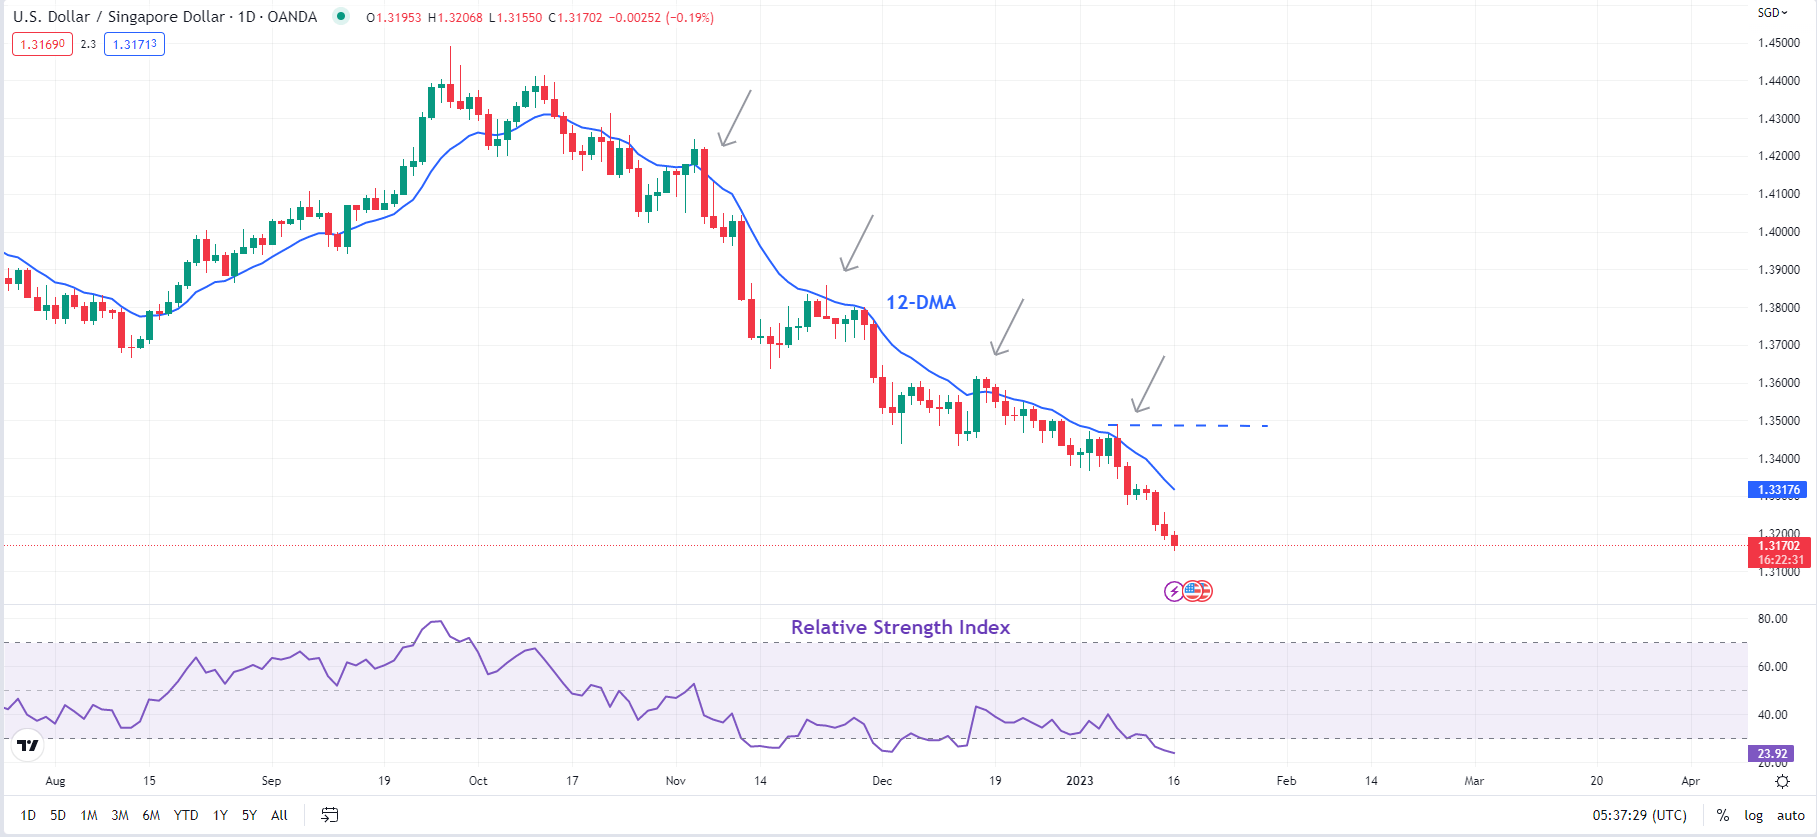
Chart Created Using TradingView
Any rebound is likely to encounter stiff resistance on the 12-day moving average – rallies since the end of 2022 have been capped by the shorter moving average (see daily chart). A stronger ceiling is at the January high of 1.3500.
USD/SGD Monthly Chart
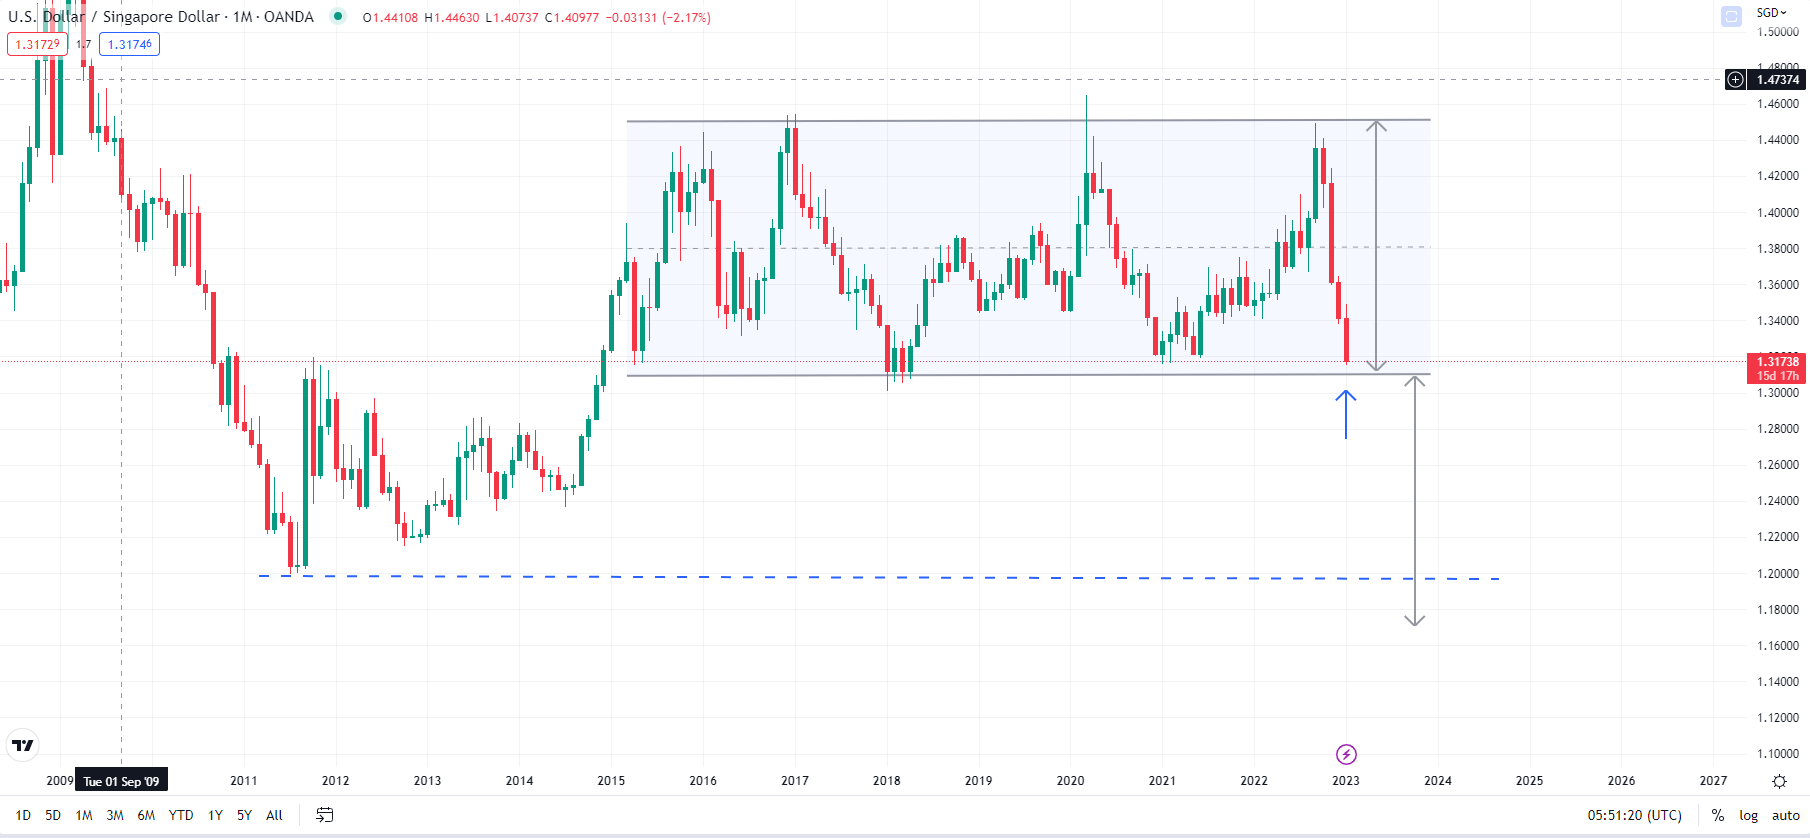
Chart Created Using TradingView
Beyond any corrective rebound, USD/SGD has scope to fall further on a medium-, to long-term basis. Any break below the converged support at 1.3000-1.3150 would trigger a breakout from the multi-year sideways channel, opening the door toward the 2011 low of 1.1985.

--- Written by Manish Jaradi, Strategist for DailyFX.com


