


The Singapore dollar’s multi-year weakness against the US dollar could well be over and it could be set to extend gains in the coming year.
Let’s begin with the ultra-big picture quarterly charts. A few noteworthy aspects stand out. Since the rally began around 2014, USD/SGD has held below major resistance on the 89-quarter moving average. Despite the US dollar strength, the pair couldn’t clear any significant price pivot – the March 2009 high of 1.5580 being an important one.
Furthermore, even though the trend was pronounced on lower timeframe charts, the Moving Average Convergence Divergence (MACD) indicator on the quarterly chart has flirted around zero in recent years. That is, on the quarterly chart, USD/SGD was at best in a range, rather than trending up (see chart). In other words, the rally since 2014 was corrective, rather than a reversal of the two-decade weakness. When the MACD indicator is decisively above zero it indicates bullishness, and vice versa.
USD/SGD Quarterly Chart
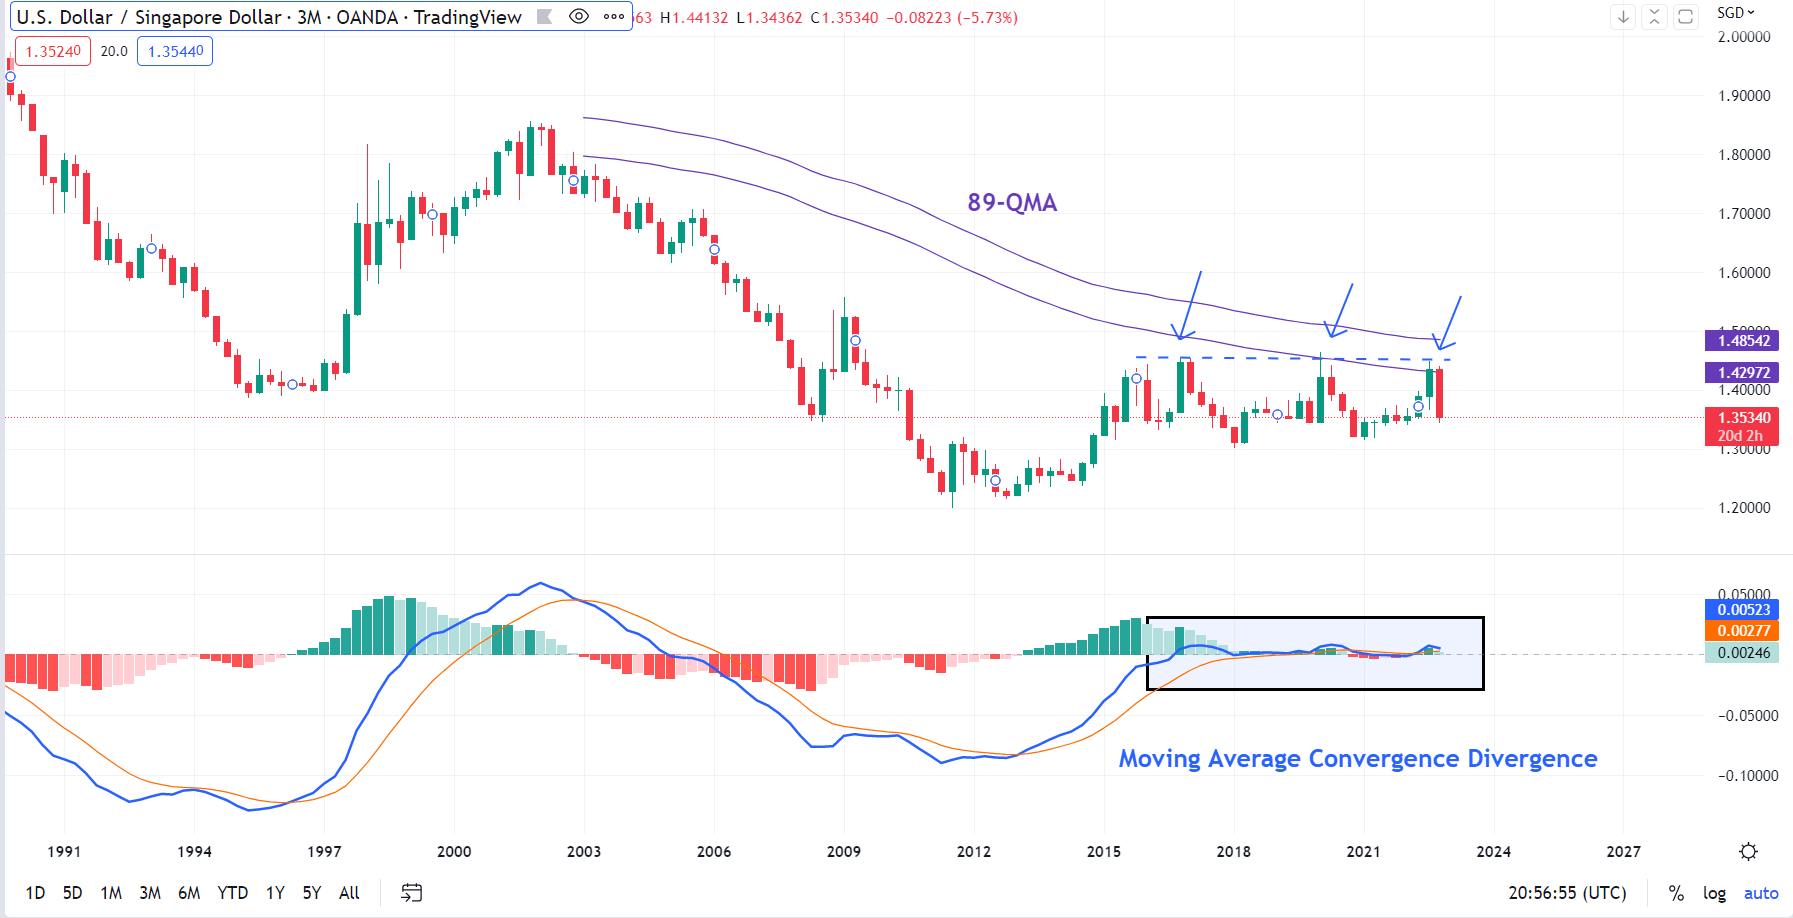
Chart Created Using TradingView
On the monthly chart, the story is similar. USD/SGD in September failed yet again to break past stiff resistance on the upper edge of a sideway channel from early 2016 (at about 1.4500). The lower edge of the channel is a horizontal trendline from 2015 (at about 1.3150). Once again, the feeble momentum associated with the jump in September was an indication that this year’s gains in the pair were more of an oscillation within the channel, and not the start of a new uptrend.
USD/SGD Monthly Chart
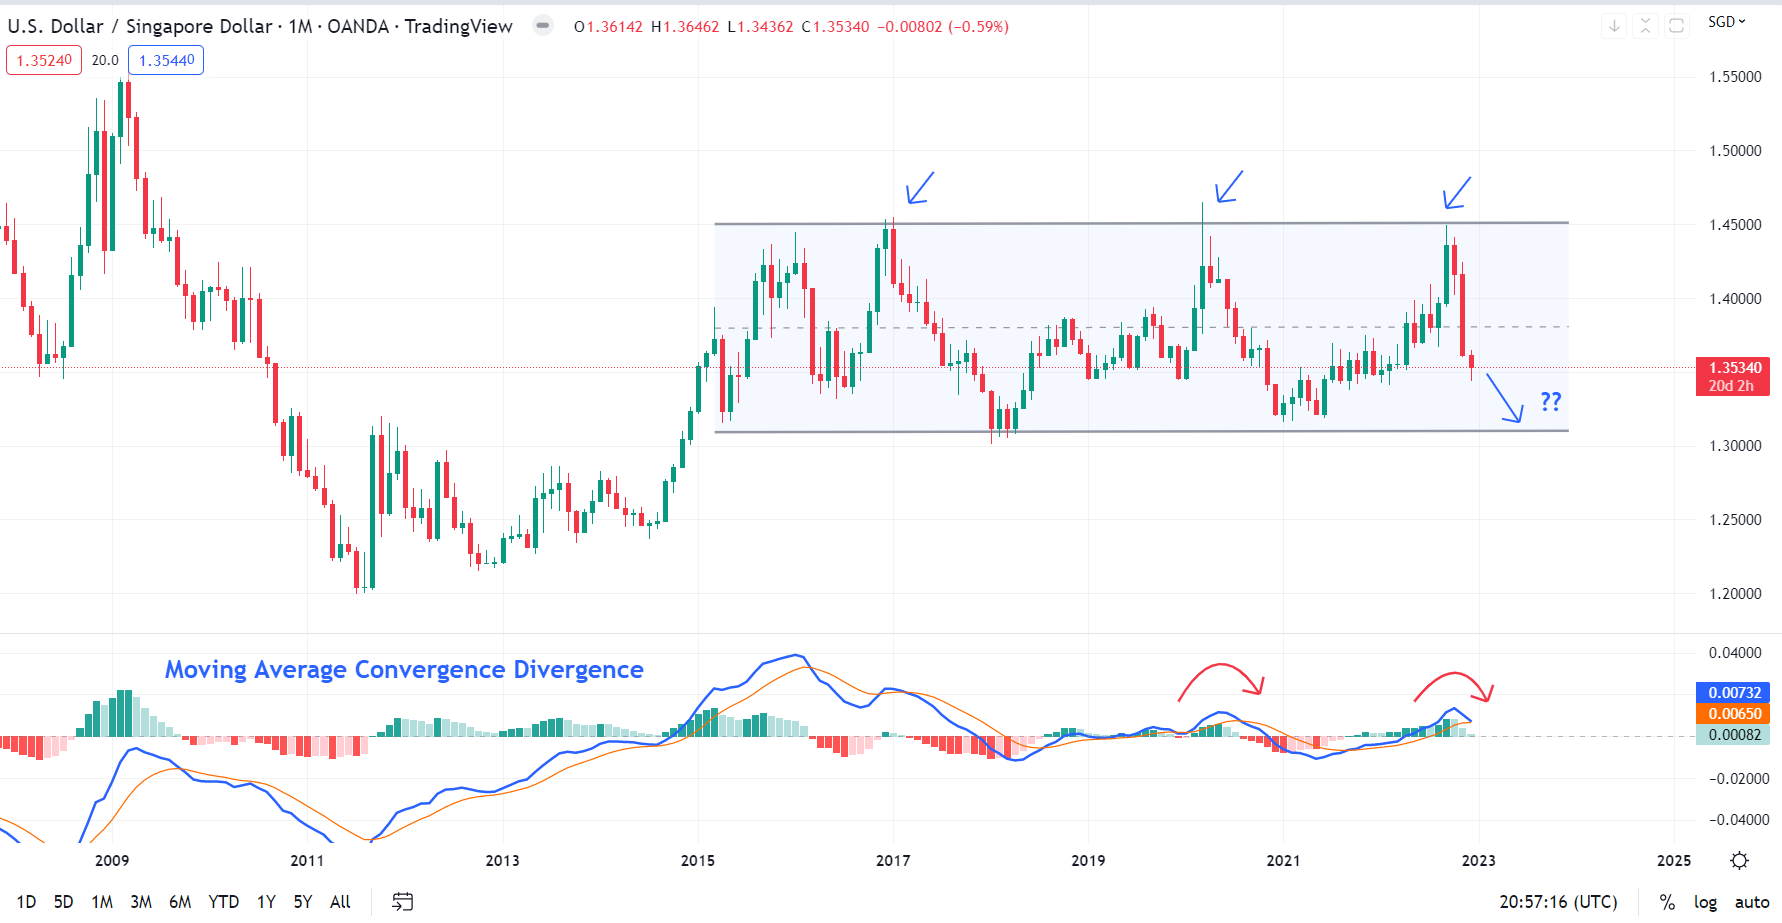
Chart Created Using TradingView
The decisive fall below vital cushion on the 200-day moving average implies that the pair could be headed toward the lower edge of the sideway channel. On the upside, USD/SGD faces stiff hurdle at the late-November high of 1.3860, roughly coinciding with the support-turned-resistance on the 200-day moving average.
--- Written by Manish Jaradi, Strategist for DailyFX.com


