


SGD, Singapore Dollar, USD/SGD - Technical Outlook:
- USD/SGD has scope to fall from a medium-term perspective.
- In the near term, a range could be developing.
- What are the key levels to watch?

USD/SGD SHORT-TERM TECHNICAL FORECAST - NEUTRAL
The Singapore Dollar’s sharp rise against the US Dollar over the past few weeks is a strong signal that the worst could well be over for the Asian currency.
USD/SGD in September failed yet again to break past stiff resistance on the upper edge of a sideway channel from early 2016 (at about 1.4525). Previous attempts in late 2016 and 2020 were also unsuccessful. The lower edge of the channel is a horizontal trendline from 2015 (at about 1.3150). The feeble momentum associated with the jump in September was an indication that this year’s gains in the pair were more of an oscillation within the channel, and not the start of a new uptrend (see Monthly chart).
USD/SGD Monthly Chart
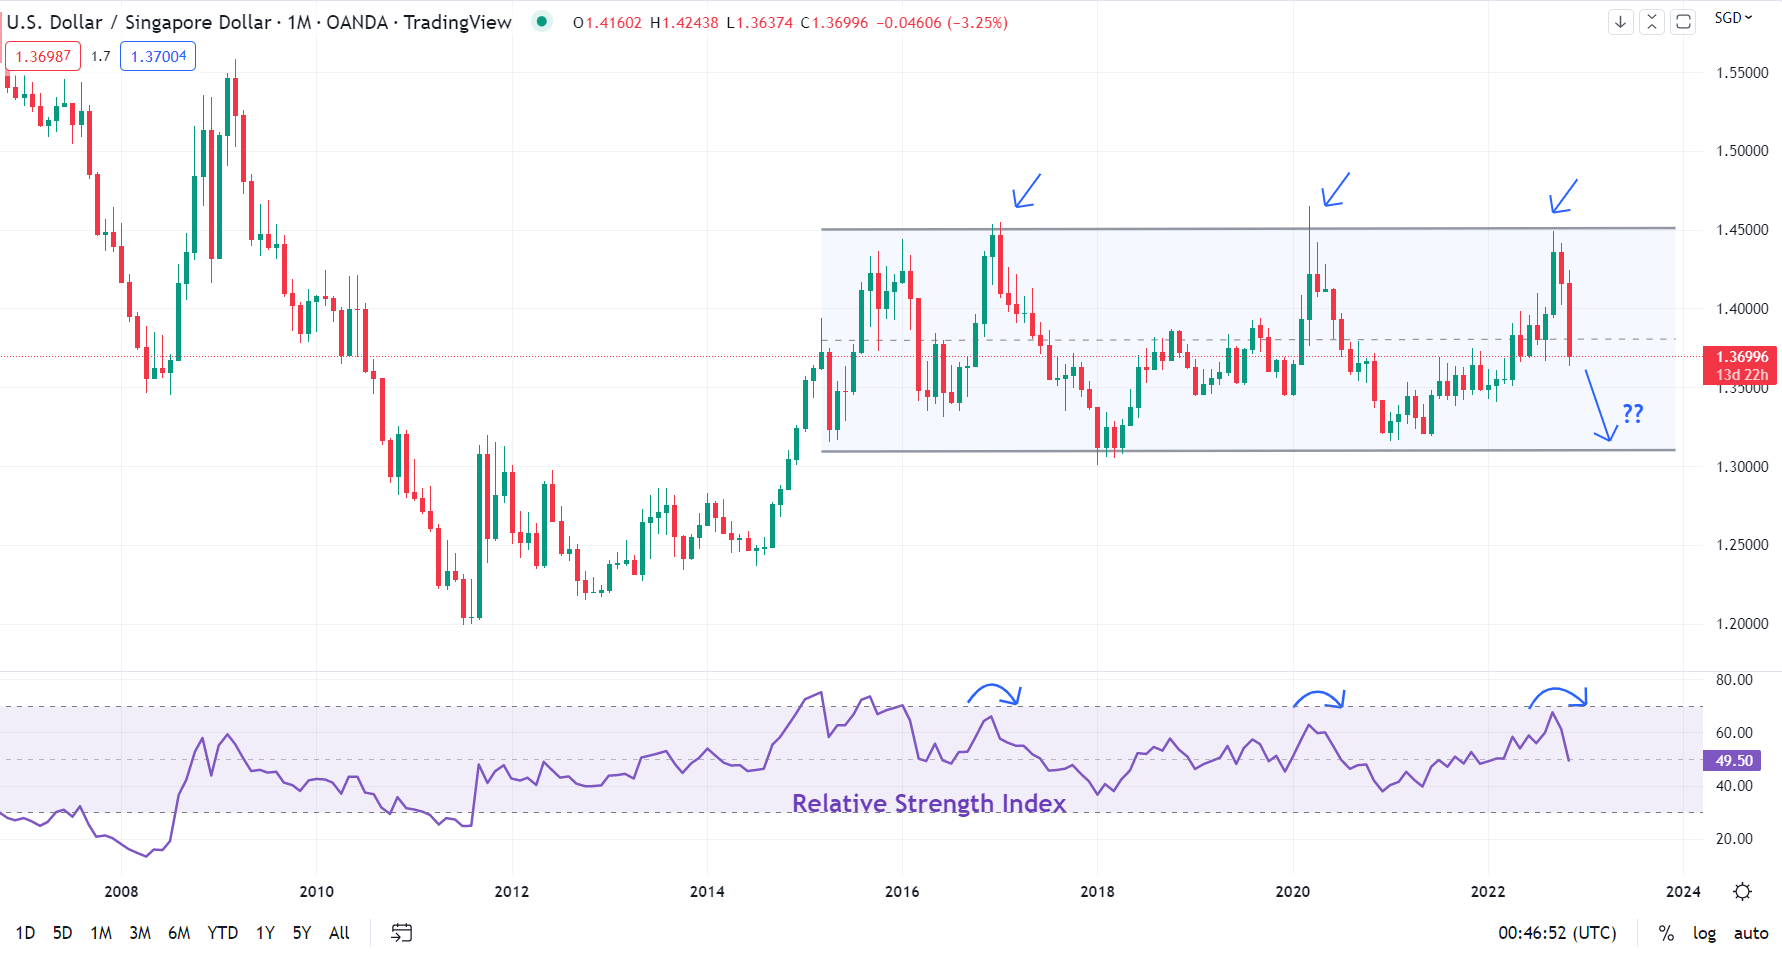
Chart Created Using TradingView
Not only that USD/SGD remains well within its seven-year range, but the sharp retreat since October implies that the pair could be headed toward the lower edge of the sideway channel for two reasons. Firstly, the fall below the cushion at the July high of 1.4100 confirmed that the short-term upward pressure has faded. Secondly, the fall below the 200-day moving average raises the odds that the medium-term strength could be reversing (see Daily chart).
USD/SGD Daily Chart
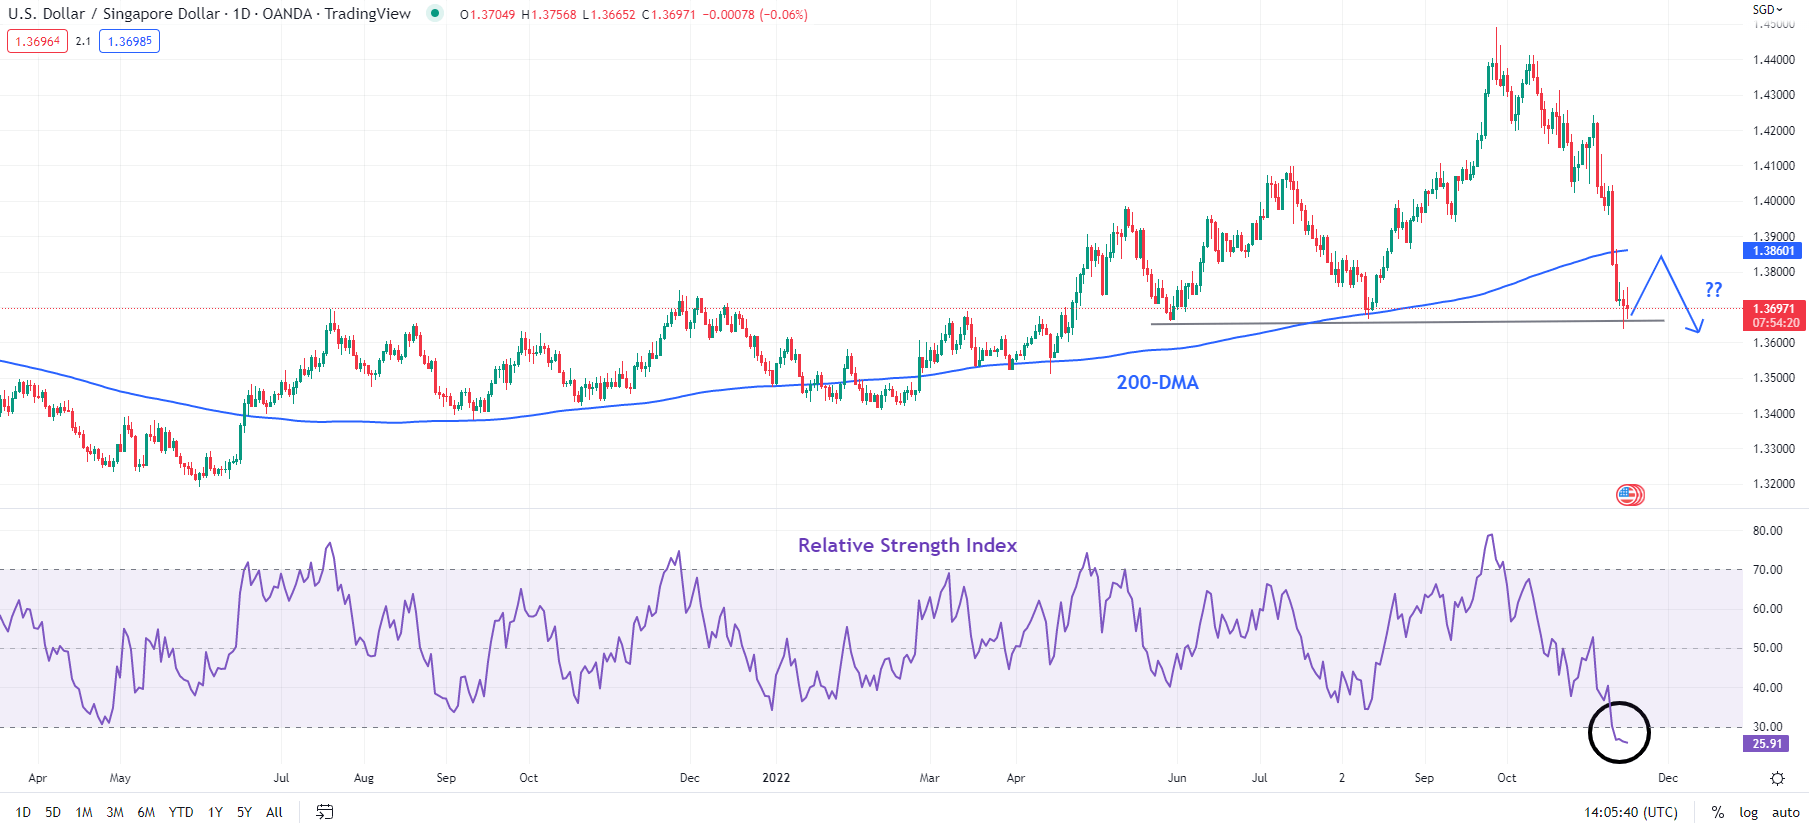
Chart Created Using TradingView
In this regard, the focus is now on key support on a horizontal trendline from May (at about 1.3650). A decisive break below would confirm that the medium-term upward pressure had eased, opening the way toward the early-2022 low of 1.3400, potentially the lower edge of the sideway channel at 1.3150.
However, before that, oversold conditions raise the prospect of a minor rebound in USD/SGD, potentially toward the 200-day moving average (at about 1.3850). However, any rebound could be short-lived and USD/SGD could eventually turn lower. That’s because the 14-day Relative Strength Index hit the lowest level in nearly two years, suggesting strong momentum on the downside, with more losses in cards in the coming weeks/months.

--- Written by Manish Jaradi, Strategist for DailyFX.com


