


Natural Gas, Falling Wedge Breakout? – Technical Update:
- Natural gas prices appear to have reinforced support
- Positive RSI divergence warns of a possible reversal
- This is as prices are trying to breakout above a wedge
Trade Smarter - Sign up for the DailyFX Newsletter
Receive timely and compelling market commentary from the DailyFX team
Daily Chart – Prices Ready to Bounce?
Natural gas prices appeared to find support once again after losses throughout most of this month. The heating commodity has made its way to the February low at 1.967 – as expected. But, prices were unable to breach this floor. This is as positive RSI divergence was brewing. This is a sign of fading downside momentum which can at times precede a turn higher.
A turn higher from here would place the focus on the 50-day Simple Moving Average (SMA). The latter could hold as resistance, maintaining the downside focus. If not, further gains would place the focus on the February high at 3.027. Keep in mind that the falling trendline from last year is still maintaining the dominant bearish bias.
Further losses would expose the 23.6% Fibonacci extension level at 1.696 before the 2020 low at 1.44 comes into focus.
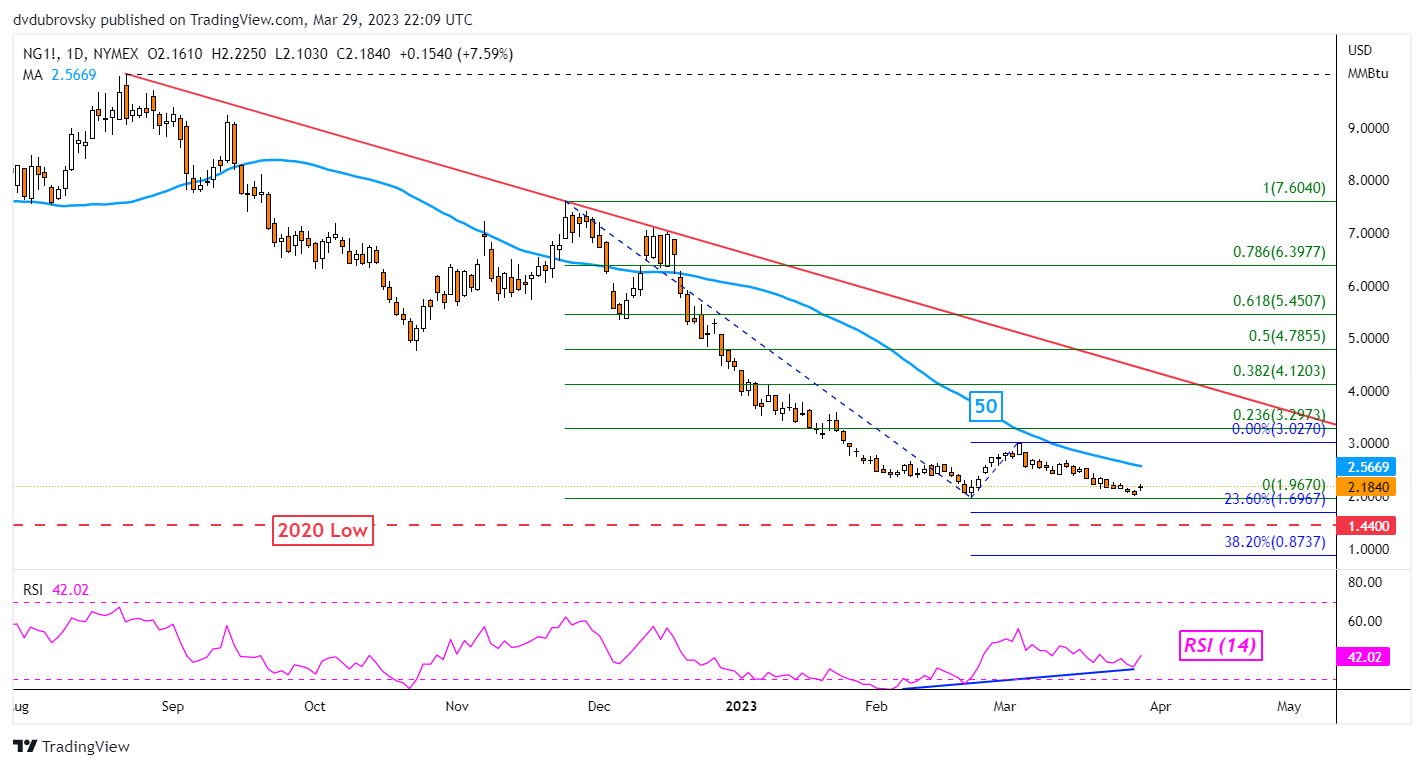
Chart Created Using TradingView
4-Hour Chart – Falling Wedge Breakout
On the 4-hour setting, natural gas appears to be eyeing an upside breakout through a Falling Wedge chart formation. Immediate resistance is the 78.6% Fibonacci retracement level at 2.195. A confirmatory upside push could open the door to a near-term bullish bias, perhaps opening the door to reversing the downtrend seen throughout March.
That would place the focus on the 100-period SMA. This could still hold as resistance, pivoting prices lower. If not, further upside progress could be in store. That would place the focus on the 38.2% and 23.6% Fibonacci retracement levels at 2.622 and 2.777, respectively. Otherwise, if resistance holds, that would place the focus on 1.968.

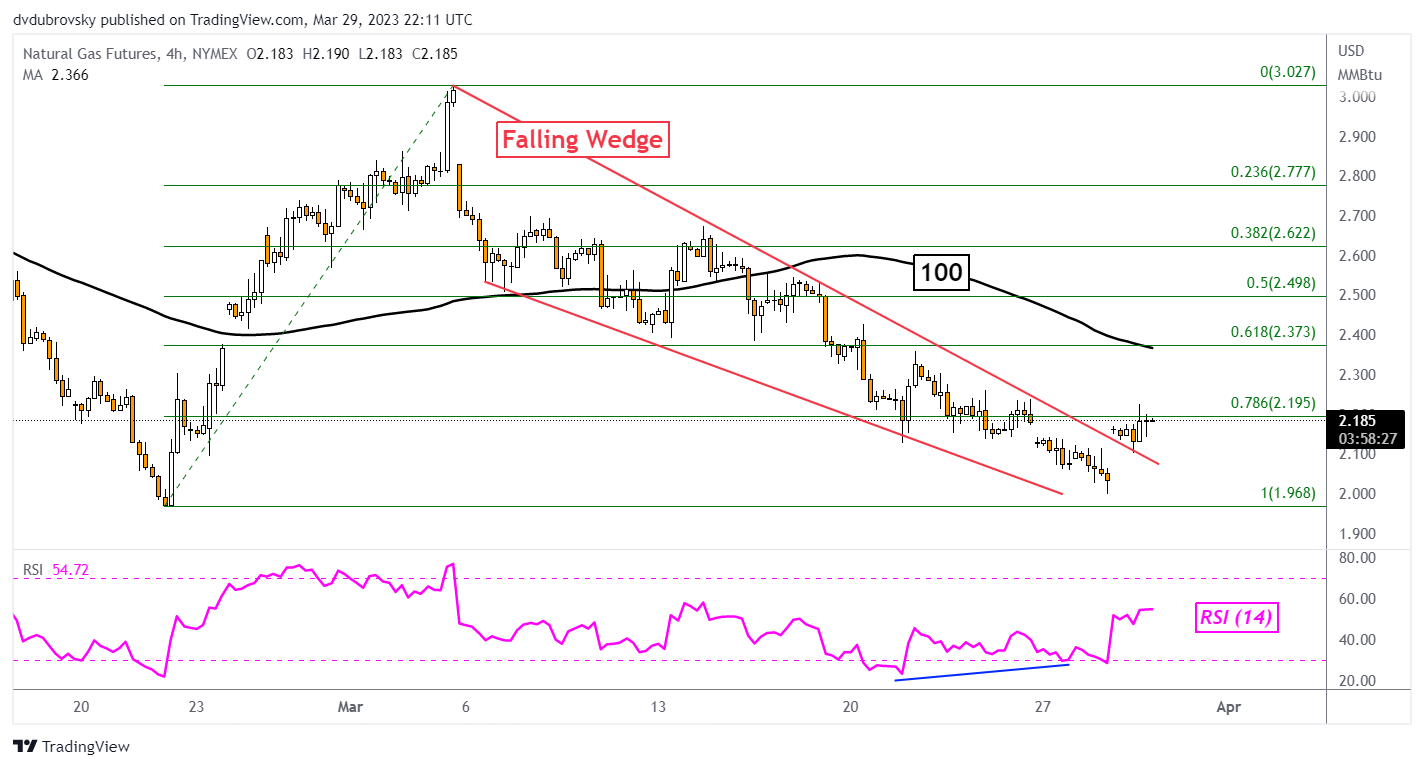
Chart Created Using TradingView
--- Written by Daniel Dubrovsky, Senior Strategist for DailyFX.com
To contact Daniel, follow him on Twitter:@ddubrovskyFX


