


Natural Gas, Falling Wedge, Week Ahead – Technical Update:
- Natural gas fell 12.5% from last week’s high to the close
- The broader downside trajectory remains in focus ahead
- Falling Wedge chart pattern a key highlight on the 4-hour
Trade Smarter - Sign up for the DailyFX Newsletter
Receive timely and compelling market commentary from the DailyFX team
Weekly Chart – Prices Consolidate Around the March 2021 Low
Natural gas prices fell 3.8% last week, but if you measure from the high, it was closer to 12.5% as the heating commodity reversed intra-week gains. This price action continues to follow the broader bearish trajectory implied by the Head & Shoulders chart formation from late 2022. Looking back, natural gas was consolidating around the March 2021 low at 2.422. That has generally been the case since prices reached this point back in late January. Let us take a closer look at the daily and 4-hour charts to see what this week’s technical outlook looks like.
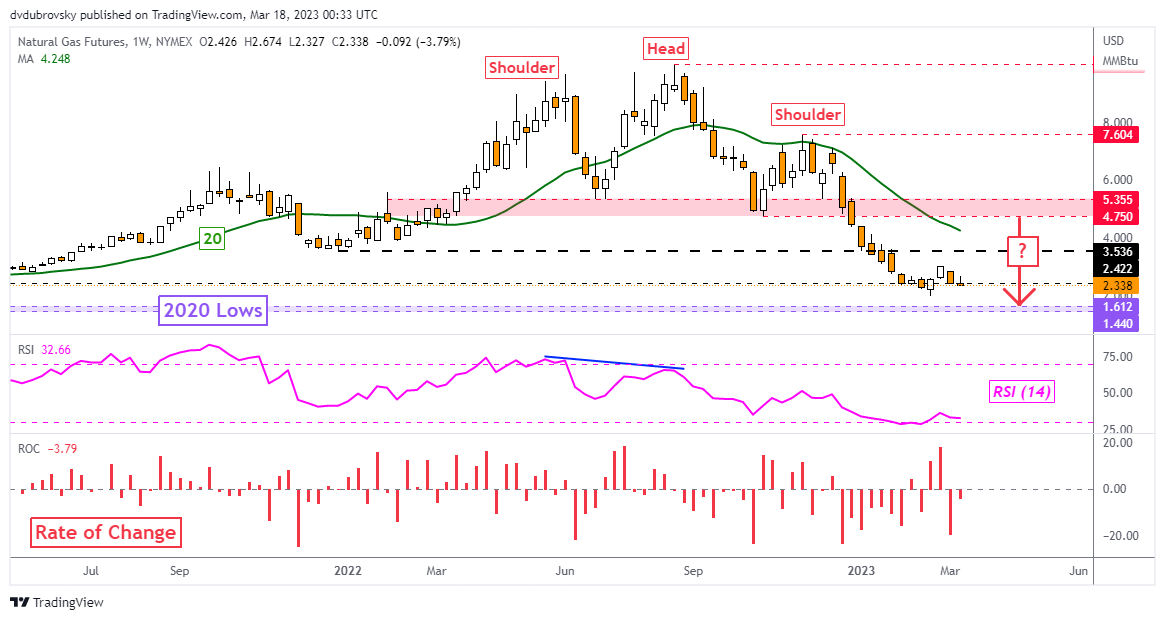
Chart Created Using TradingView
Daily Chart – February 3rd Low in Focus
On the daily chart, natural gas fell to the February 3rd low at 2.341 last week. As prices were unable to clear this point, it was reinforced as key support. Confirming a downside breakout under this price would open the door to revisiting the February low (which is also the current 2023 low) at 1.967. Otherwise, in the event of a turn higher, the 50-day Simple Moving Average (SMA) remains as key resistance. Closing above this line exposes the March high at 3.02.
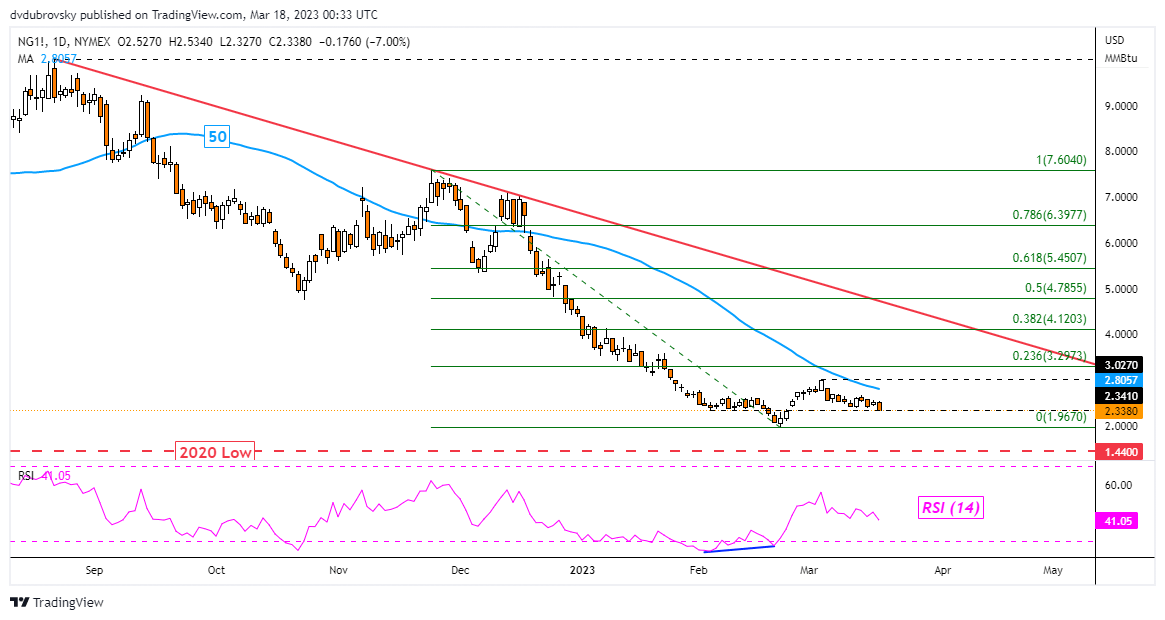
Chart Created Using TradingView
4-Hour Chart – Falling Wedge Remains in Play
Zooming in on the 4-hour chart, we can see that natural gas continued trading within the boundaries of a bullish Falling Wedge chart formation. The immediate outlook remains bearish, following the downside trajectory of this pattern. That said, a confirmatory upside breakout would open the door to an increasingly short-term bullish perspective. That would place the focus on the 38.2% Fibonacci retracement level at 2.622 followed by the 23.6% point at 2.777. Otherwise, extending lower places the focus on the February low.

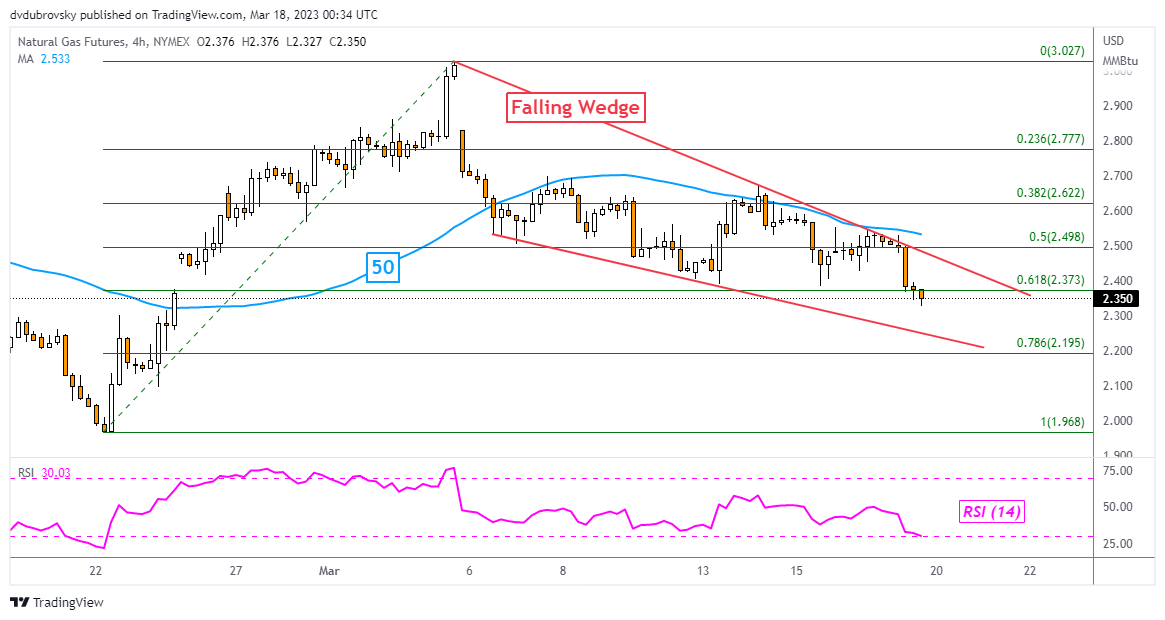
Chart Created Using TradingView
--- Written by Daniel Dubrovsky, Senior Strategist for DailyFX.com
To contact Daniel, follow him on Twitter:@ddubrovskyFX


