


US Dollar, Japanese Yen, USD/JPY - Technical Outlook:
- USD/JPY is holding above crucial support over the past two weeks or so.
- Key focus is on the US Fed rate decision.
- What are the key signposts to watch?

USD/JPY SHORT-TERM TECHNICAL FORECAST – NEUTRAL
The Japanese yen’s rally against the US dollar appears to have stalled in recent days as the market looks for further cues from the upcoming US Federal Reserve Open Market Committee meeting.

While the market widely expects the Fed to hike rates by 25 basis points to 4.5%-4.75% on Wednesday, the accompanying statement will be closely watched, particularly if the Fed signals it is reaching an inflection point in the rate hiking cycle. If the Fed is less hawkish than expected, it could weigh on the US dollar. The futures market currently expects rates to top around 4.9% on growing signs that US inflation could be peaking.
USD/JPY Weekly Chart
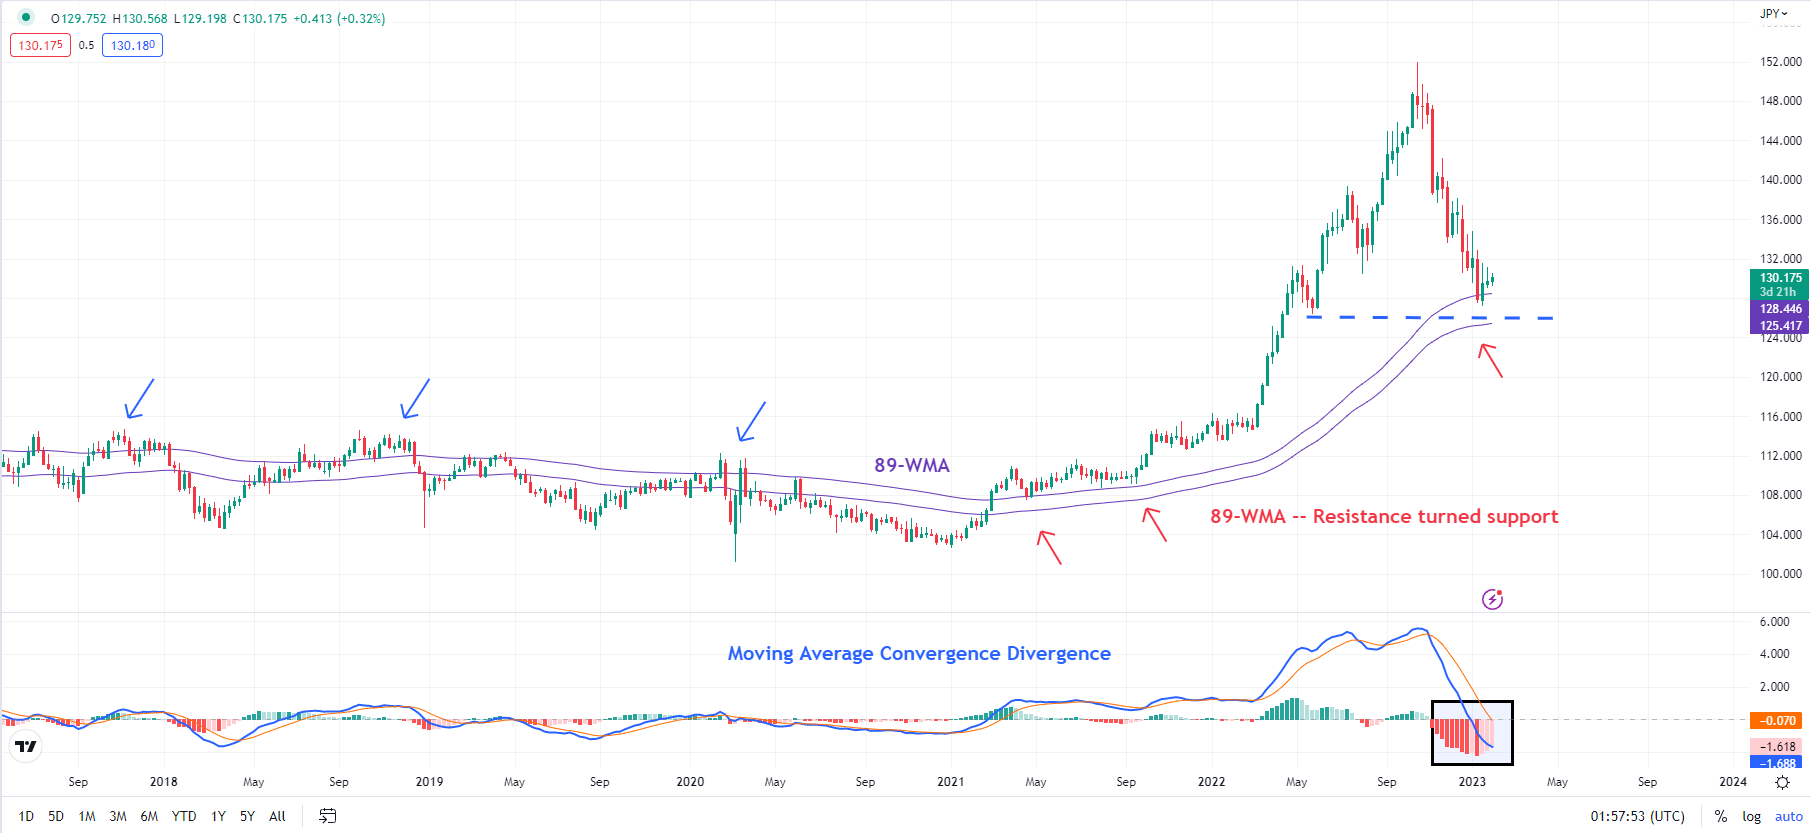
Chart Created Using TradingView
This comes as USD/JPY tests a vital support zone: the 89-week moving average, coinciding with the May 2022 low of 126.30 (see weekly chart). The recent pattern does give an impression of some sort of base building taking place, but the momentum continues to be on the downside, though faded a bit recently. Unless USD/JPY breaks above immediate resistance at the mid-January high of 131.60, the path of least resistance remains sideways/slightly down.
USD/JPY 240-minutes Chart
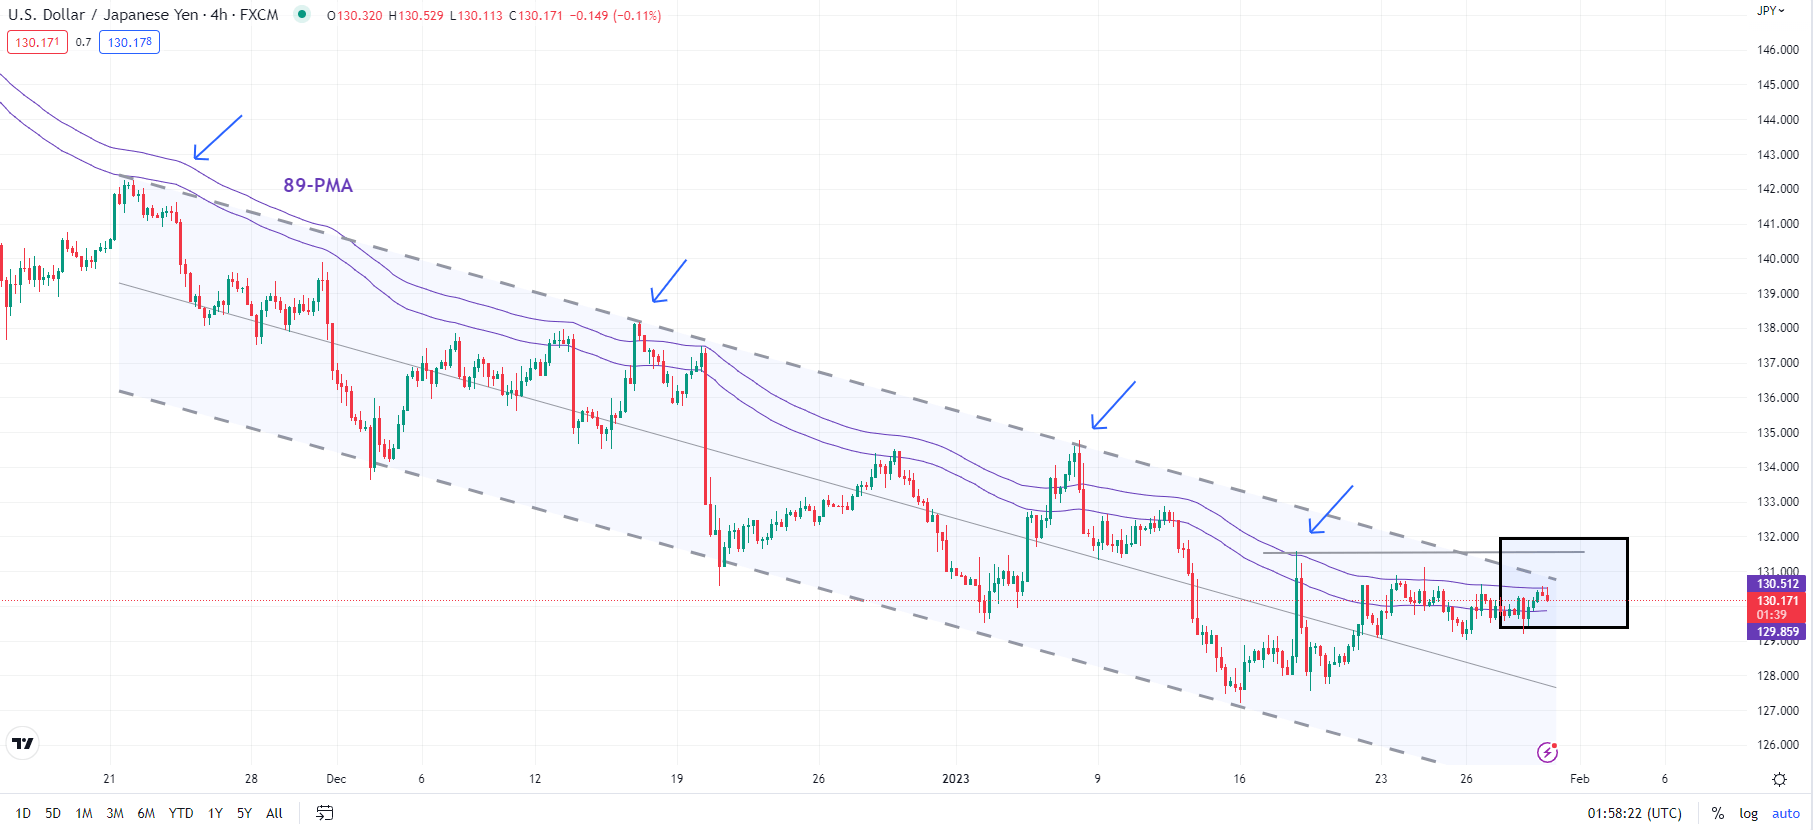
Chart Created Using TradingView
As noted in the previous update, any break above the 89-period moving average on the 240-minute chart, near the upper edge of a declining channel since November, around 131.60, would be an indication that the three-month-long downward pressure is fading. Moreover, on the daily charts, the stalling of momentum even as the price made a fresh low earlier this month could be a sign that the slide is losing steam.
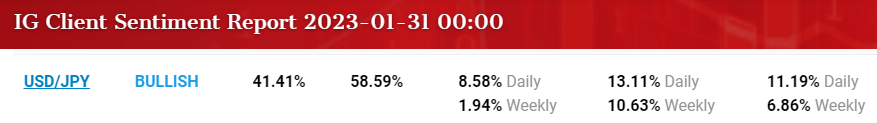
Source: IG
--- Written by Manish Jaradi, Strategist for DailyFX.com


